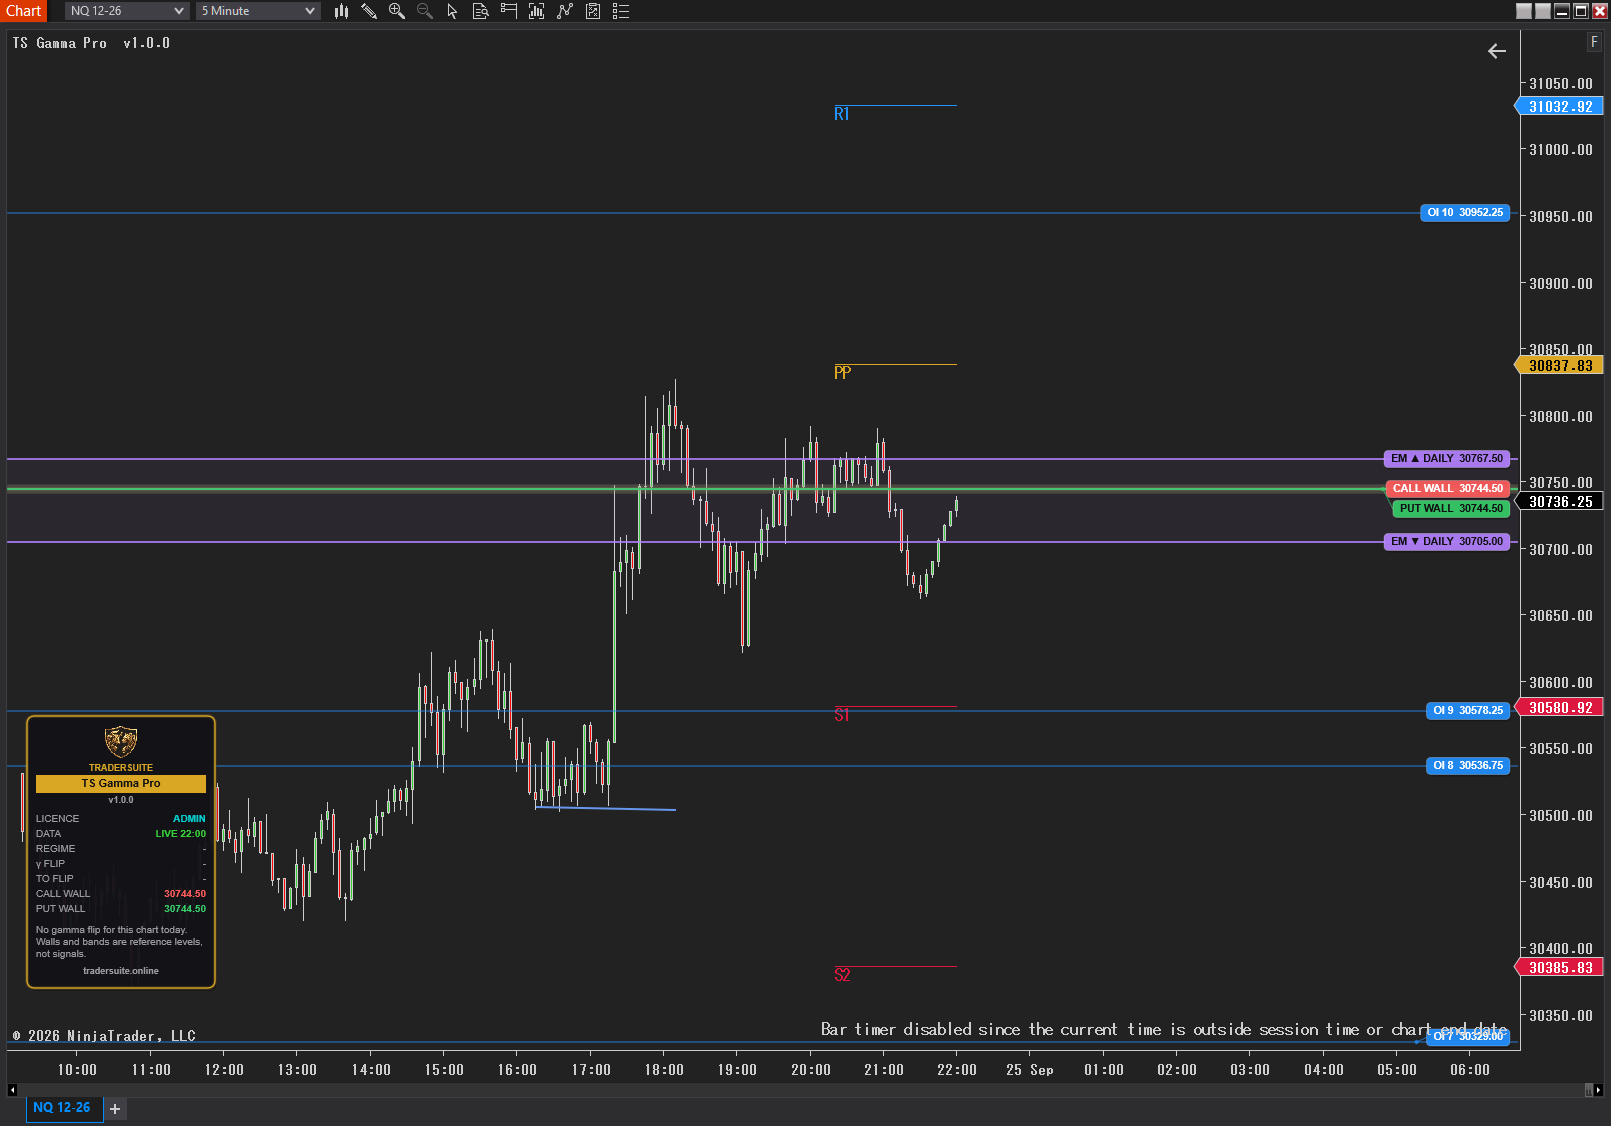
TS Gamma Pro – GEX Levels
GEX indicator for NinjaTrader 8: gamma flip (zero gamma), call wall, put wall and expected-move bands drawn live on your NQ and ES futures chart. One-time price.
Secure download
Instant access
Lifetime updates
Free forever
2 activations
Per licence
Documentation
Download user guide
Gamma exposure (GEX) levels for NinjaTrader 8 — on your NQ and ES chart, no subscription
TS Gamma Pro is a gamma exposure indicator for NinjaTrader 8. It draws the options market's key prices — the gamma flip (zero gamma), the call wall, the put wall, the daily and weekly expected move and the top open-interest strikes — on NQ, MNQ, ES and MES futures charts, and keeps them up to date through the trading day. Most GEX tools for NinjaTrader charge a monthly fee. This one is a one-time purchase, and it is included in Pro Membership.
What are gamma levels, and why do futures traders use them?
Option dealers hedge the positions they hold. That hedging leaves footprints at a handful of strikes, and those strikes often act as support, resistance and turning points on the futures that track the same index. Gamma levels show you where that dealer positioning sits, so you can see where price is likely to slow, bounce or accelerate before it gets there.
- Gamma flip / zero gamma — the price where dealer gamma changes sign. Above it, dealers tend to dampen moves (ranges, fades). Below it, they tend to amplify moves (wider, faster ranges). Drawn as a dashed gold line with a soft glow.
- Call wall and put wall — the strikes carrying the heaviest call gamma and put gamma. They often act as a ceiling and a floor for the day. Red and green, with a glow.
- Daily and weekly expected move — the range the options market has priced in for today and for the week, drawn as purple and pink bands with the daily band shaded.
- Top open-interest (OI) strikes — up to ten thin blue lines where the most contracts sit.
Live GEX levels, delivered — not typed in
The TraderSuite server reads the SPX, NDX, SPY and QQQ options chains, works out the levels every five minutes during US market hours, and the indicator fetches them in the background every two minutes. No spreadsheets, no copying numbers from a website, and the chart never freezes while it waits. QQQ or NDX levels are scaled onto NQ, and SPY or SPX onto ES, automatically — the scale is locked each time new data arrives, so lines never creep between updates. Choose a 0DTE, 3-day, 8-day or 30-day expiry window by changing one word in the settings.
Built to be read at a glance
Every level has its own colour and its own price pill at the right edge of the chart. The pills are pushed apart so they never overlap, however far you zoom, and when the chart is too short for all of them the important ones (flip, walls, expected move) win. A compact branded panel shows your licence, data health, the gamma regime (▲ POSITIVE γ or ▼ NEGATIVE γ), the signed distance to the flip, both walls and — in full mode — both expected moves, the data source and today's level count. A one-line hint at the foot of the panel tells you what the current regime usually means for the session.
Honest by design
Levels older than your chosen age (90 minutes by default) are cleared rather than left on screen. A failed update keeps the last good levels and prints the reason in full. Earlier days are drawn faded so you can see how price treated yesterday's walls. And if you would rather use your own numbers, clear the Server URL and load a simple five-column CSV file — with optional shaded zones around each level.
What you get
- Gamma flip (zero gamma), call wall and put wall with a soft glow so the key levels stand out
- Daily and weekly expected-move bands, daily band shaded
- Up to ten top open-interest strikes
- Live TraderSuite server feed for SPX, NDX, SPY and QQQ, with 0DTE, 3-day, 8-day and 30-day expiry windows
- Automatic scaling onto NQ / MNQ / ES / MES
- Colour-coded price pills that never overlap
- Gamma regime read-out and signed distance to the flip
- Data-freshness guard — stale levels are hidden automatically
- CSV mode for your own levels, with shaded zones
- Compact branded panel, four-corner placement, every element switchable
- 22 plain-English settings, all documented
- 18-page illustrated PDF user guide
- One-time price, 7-day free trial, lifetime updates — no monthly GEX subscription
Questions traders ask about GEX indicators
Is this real-time options data?
No. The levels are built from delayed options data (about 15 minutes), and open interest updates once a day before the open. The panel always shows how old the levels are. Gamma levels move slowly through the day, so a 15-minute delay changes very little.
Which symbol should I use for NQ or ES?
QQQ (the default) or NDX for NQ and MNQ. SPY or SPX for ES and MES. You change one word in the Server URL and the indicator scales the levels onto your chart.
What is the difference between the gamma flip and zero gamma?
They are the same level under two names: the price where net dealer gamma crosses zero. Some services call it the "volatility trigger" or "gamma neutral".
Which expiry window should I use?window=1 is today's expiry only (0DTE). window=3 covers the next three days, window=8 (the default) roughly the next week and a half, and window=30 the next month.
Does it give buy and sell signals?
No. It draws reference levels and the gamma regime. Your entries and exits stay your own. If you want trade arrows off the same levels, see TS GammaLevels Pro.
Can I use my own gamma levels from another service?
Yes. Clear the Server URL and load a CSV file with Date, Symbol, Type, Price and ZoneTicks columns. The user guide shows the format.
Does it use my NinjaTrader market-data plan?
No. The levels come from the TraderSuite server over a normal internet connection. Your NinjaTrader data feed is only used to draw the chart itself.
Can I try it first?
Yes. Leave the licence key empty for an automatic 7-day free trial. Buy once and it is yours — no monthly fee.
Is it included in Pro Membership?
Yes. Pro Members unlock it with their membership key, along with every other TraderSuite indicator.
Please note: TS Gamma Pro draws reference levels and the gamma regime — it does not predict price and places no orders. Educational tool, not financial advice. Pairs well with TS Market Imbalance Zones for entries inside the gamma range.
Related products
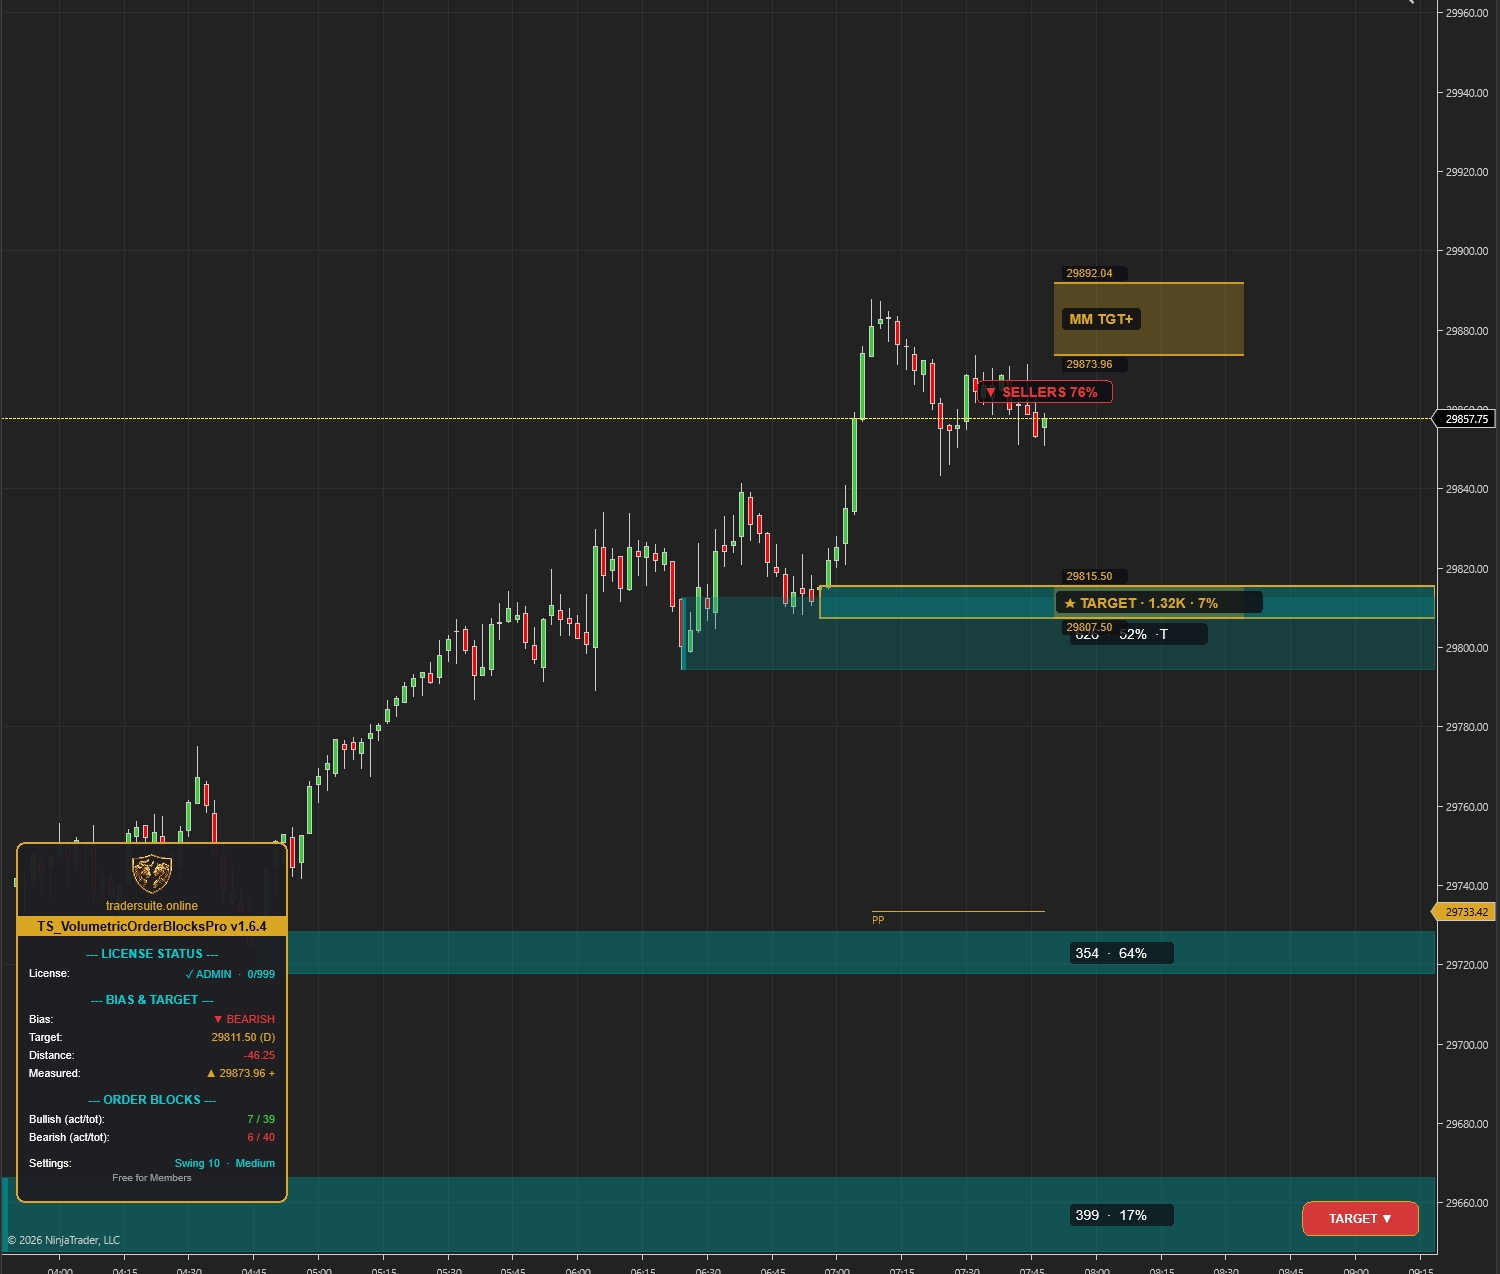
Volumetric Order Blocks Pro
Automatically detect institutional supply & demand zones with volume-weighted order blocks. Identify potential reversal zones where smart money is positioned.
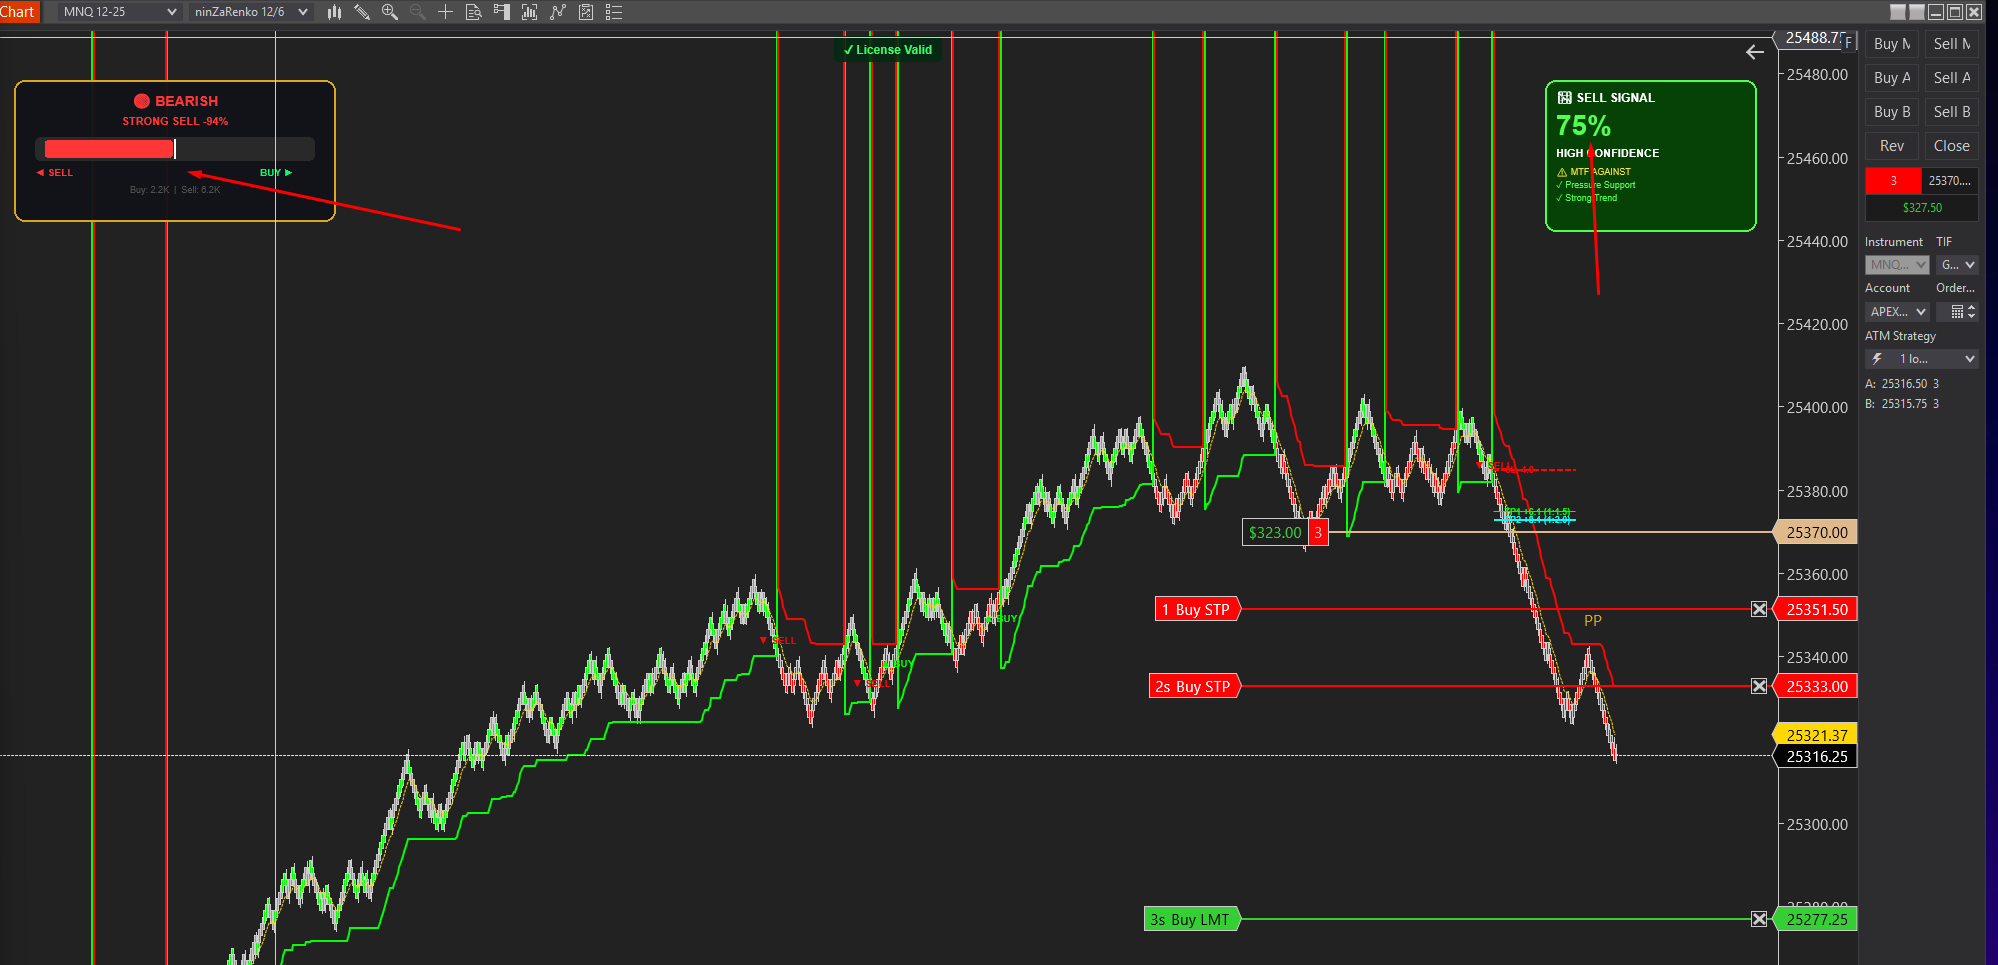
Smartflowpro
Advanced order flow analysis with real-time Pressure Delta Meter, multi-timeframe confluence scoring, and intelligent signal probability rating. Know who's in control before you trade.
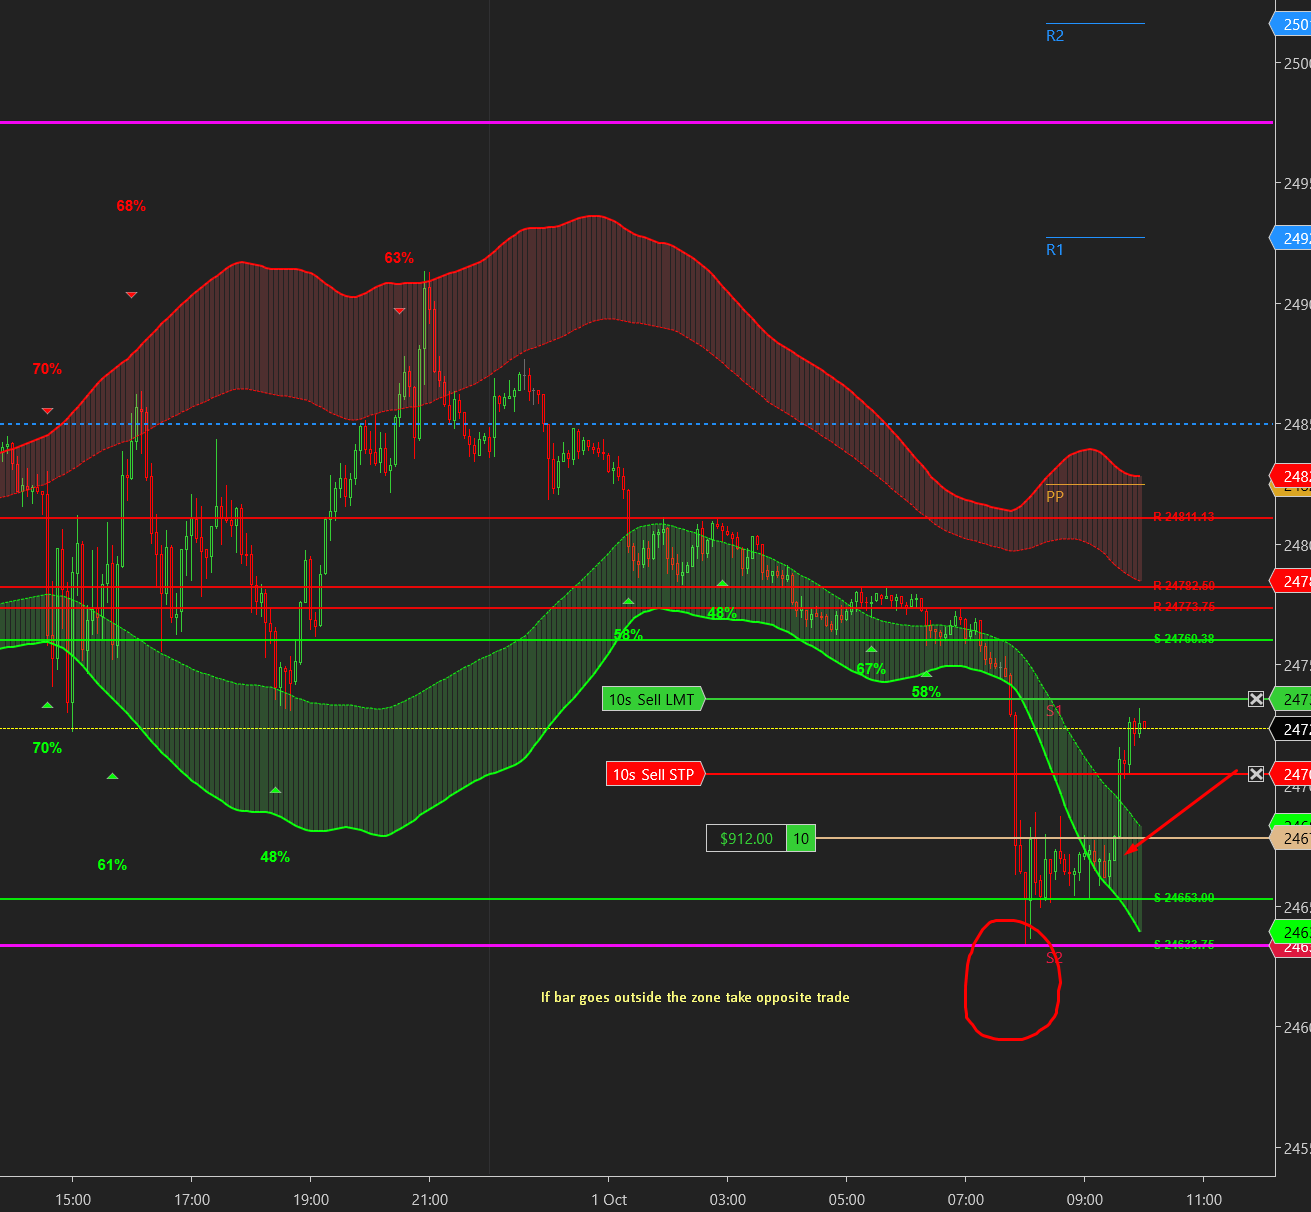
UltraADXVolatilityWaves
Professional ADX-powered volatility zones indicator with dynamic Support/Resistance, Daily/Weekly levels, ATR-based TP/SL targets, and probability-scored signals. Identify potential reversal zones in real-time.
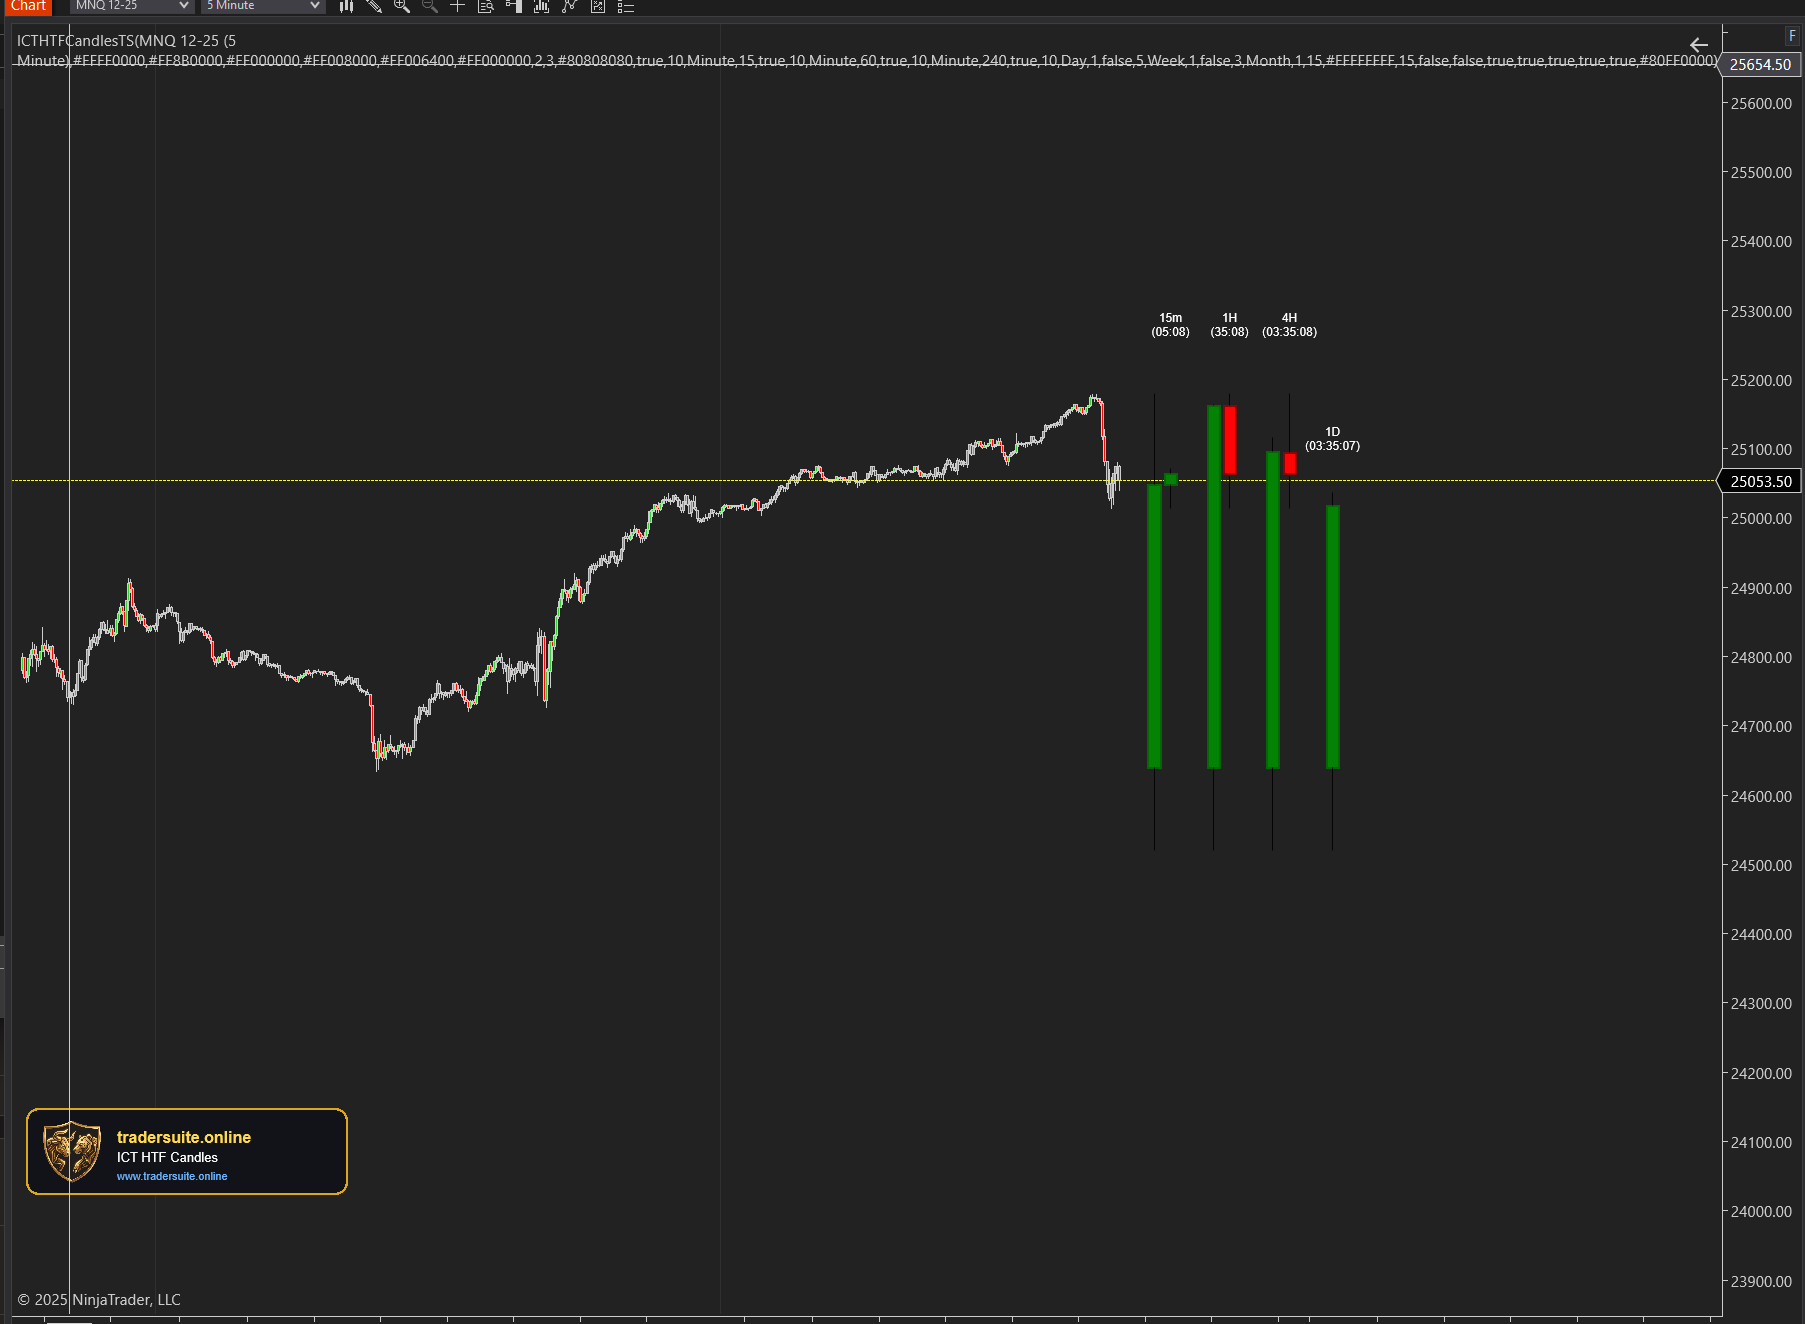
ICT HTF Candles Pro
Visualize multiple higher timeframe candles directly on your chart with real-time countdown timers, Fair Value Gap detection, and Volume Imbalance highlighting. Perfect for ICT traders who need multi-timeframe confluence without switching charts.