TS_GammaLevels_Pro
The options market's price map on your futures chart: auto-updating daily and weekly expected-move levels, call/put walls, and trade arrows that mark the bounce or break — with entry level and target in one label.
Secure Download
Instant access
Lifetime Updates
Free forever
2 Activations
Per license
Documentation
Step-by-step guides
TS_GammaLevels_Pro
The options market's price map — drawn automatically on your futures chart, updated all session. Know where the market is likely to stall, bounce, or accelerate before it gets there.
Stop trading blind into invisible levels
Ever shorted a market that "looked too high" and watched it grind higher all day? Or watched price bounce hard off a level nobody drew? Those reactions aren't random — they happen where large institutional options positioning forces real buying and selling. TS_GammaLevels_Pro reads that positioning and turns it into clear lines on your chart every morning, automatically.
Your day mapped before the open
Daily and weekly range boundaries the options market has priced in — you know the likely playing field before the first trade.
Objective targets & stops
Profit targets and invalidation references based on real positioning, not lines drawn by feel. Every level has a price on it.
Regime tells you the day's character
One glance at the panel: is today a fade-the-edges day or a ride-the-breakout day? Trading the wrong style for the day is how most accounts bleed.
Avoid the classic short trap
When an upside destination hasn't been reached yet, shorting "because it's high" is fighting the market's plan. Untagged levels warn you.
It watches, you trade
Levels refresh automatically all session and alerts fire when key boundaries are reached or the regime flips. No spreadsheet, no manual drawing.
Strategy-ready
A Signal output exposes the current regime to your NinjaScript strategies, so automated systems can switch tactics too.
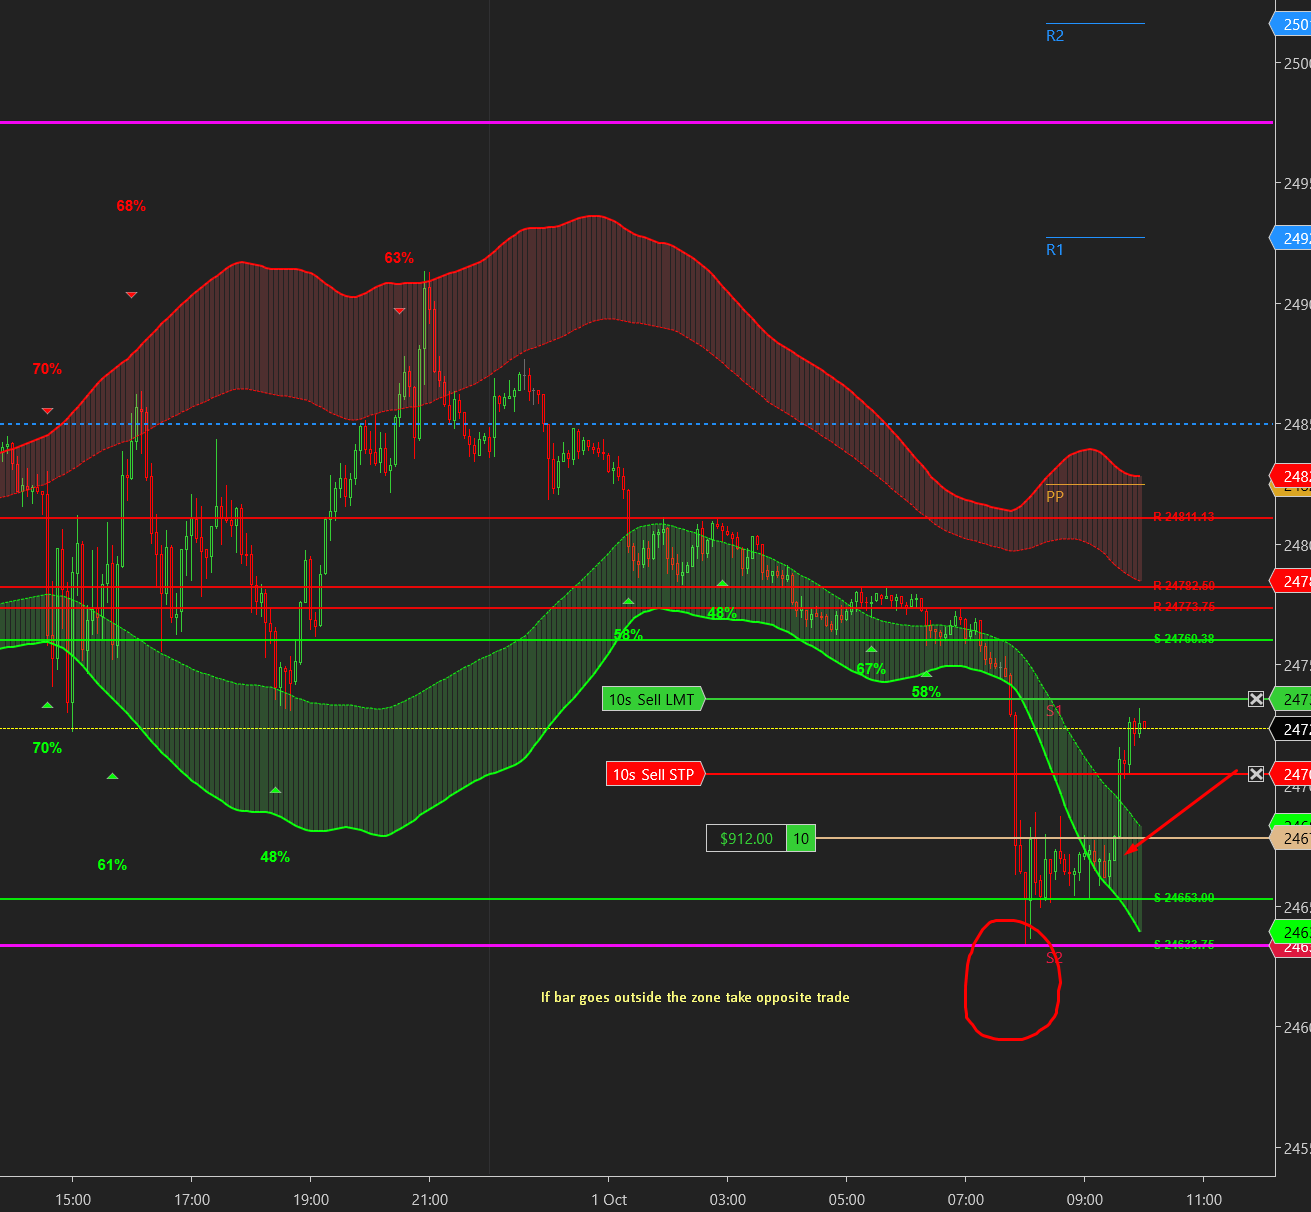
How to trade it — in plain English
Forget the technical words for a minute. The indicator paints lines on your chart. Price moves from line to line, like a ball bouncing between floors and ceilings. You trade the journey between lines. Here is the whole method:
▲ When to go LONG
1. Price is above the gold line → the market is in "calm up" mode. Think longs only.
2. Wait for price to dip down into a line below it — the gold line itself, the silver line (yesterday's close), or any line underneath.
3. Watch the dip stop falling and turn (a strong green candle at the line). That's your entry.
4. Target = the next line above (the blue upper line or the green ceiling). Take your profit there — don't wish for more.
Stop: just below the line you bought at. If a candle closes below it, the bounce failed — get out.
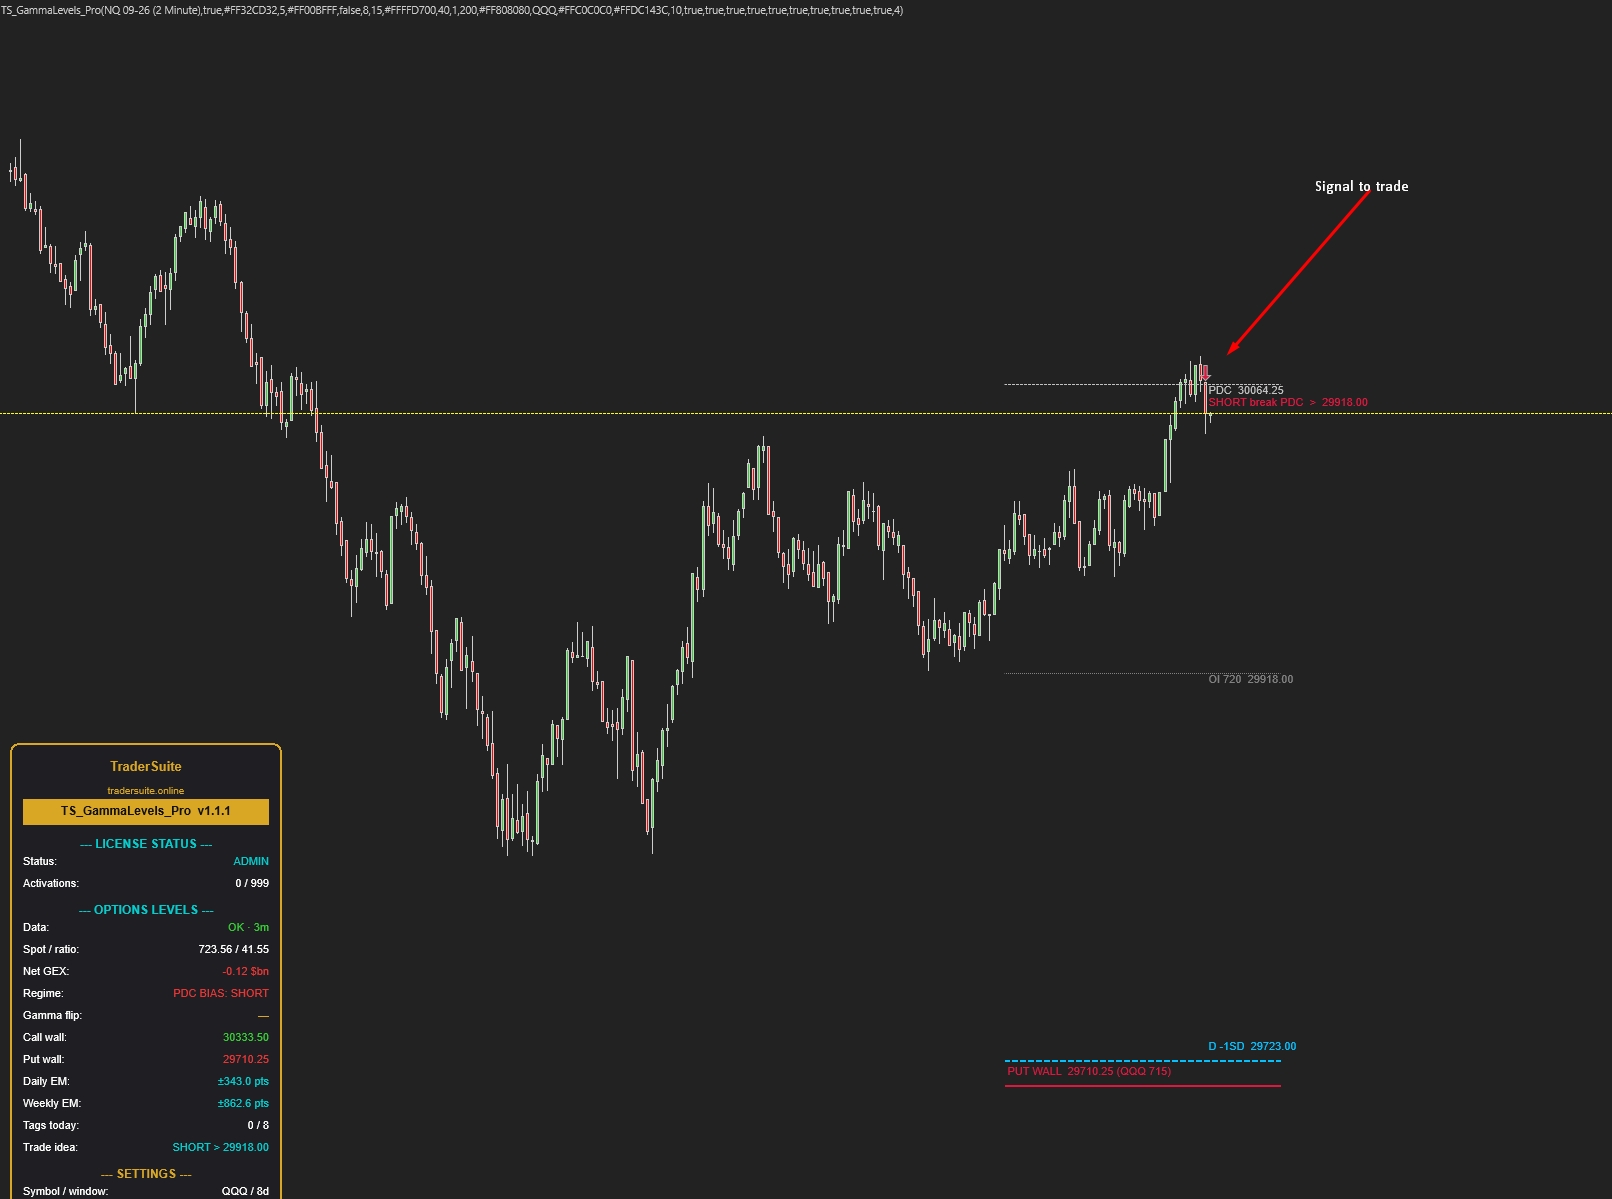
▼ When to go SHORT
1. Price is below the gold line → the market is in "fast down" mode. Think shorts only.
2. Wait for price to bounce up into a line above it — the gold line or any line overhead.
3. Watch the bounce get rejected (a strong red candle at the line). That's your entry.
4. Target = the next line below (the blue lower line or the red floor). Book it there.
Stop: just above the line you sold at. A candle closing above it means you're wrong — out, no arguing.
The five golden rules
1. The gold line decides your direction. Above it — only look for longs. Below it — only look for shorts. This one habit removes half of all bad trades.
2. Buy at lines, sell at lines. Never in the middle. The empty space between lines is where you take profit or wait — not where you enter.
3. Let the line prove itself first. Don't buy just because price touched a line. Wait for the turn — one strong candle in your direction at the line.
4. Don't short a market that hasn't reached its upper line yet. If the label above still doesn't say TAGGED, the market probably isn't done going up. Same in reverse for buying.
5. No setup, no trade. Price sitting in the middle of nowhere, or chopping right on the gold line? That's the market telling you to wait.
That's genuinely the whole method. The rest of this guide just adds detail: what each line is called, how to read the panel, and how to adjust settings.
Which instruments is it for?
Designed first for NASDAQ futures (NQ / MNQ) — the defaults work out of the box. It also works on any market with a liquid options proxy: set one input and the levels re-map automatically to your chart's prices.
| Your chart | Options Symbol setting | Notes |
|---|---|---|
| NQ / MNQ | QQQ (default) | Works immediately — recommended starting point |
| ES / MES | SPY | The deepest options market in the world |
| RTY / M2K | IWM | Small caps |
| YM / MYM | DIA | Dow |
| GC / MGC | GLD | Gold — proxy mapping, slightly looser |
| QQQ, SPY, IWM, DIA (stock/ETF charts) | The ETF itself | Levels land 1:1 on the chart |
Best on 1–15 minute intraday charts. Not suitable for instruments without a liquid, closely-related options market (exotic crypto pairs, thin commodities).
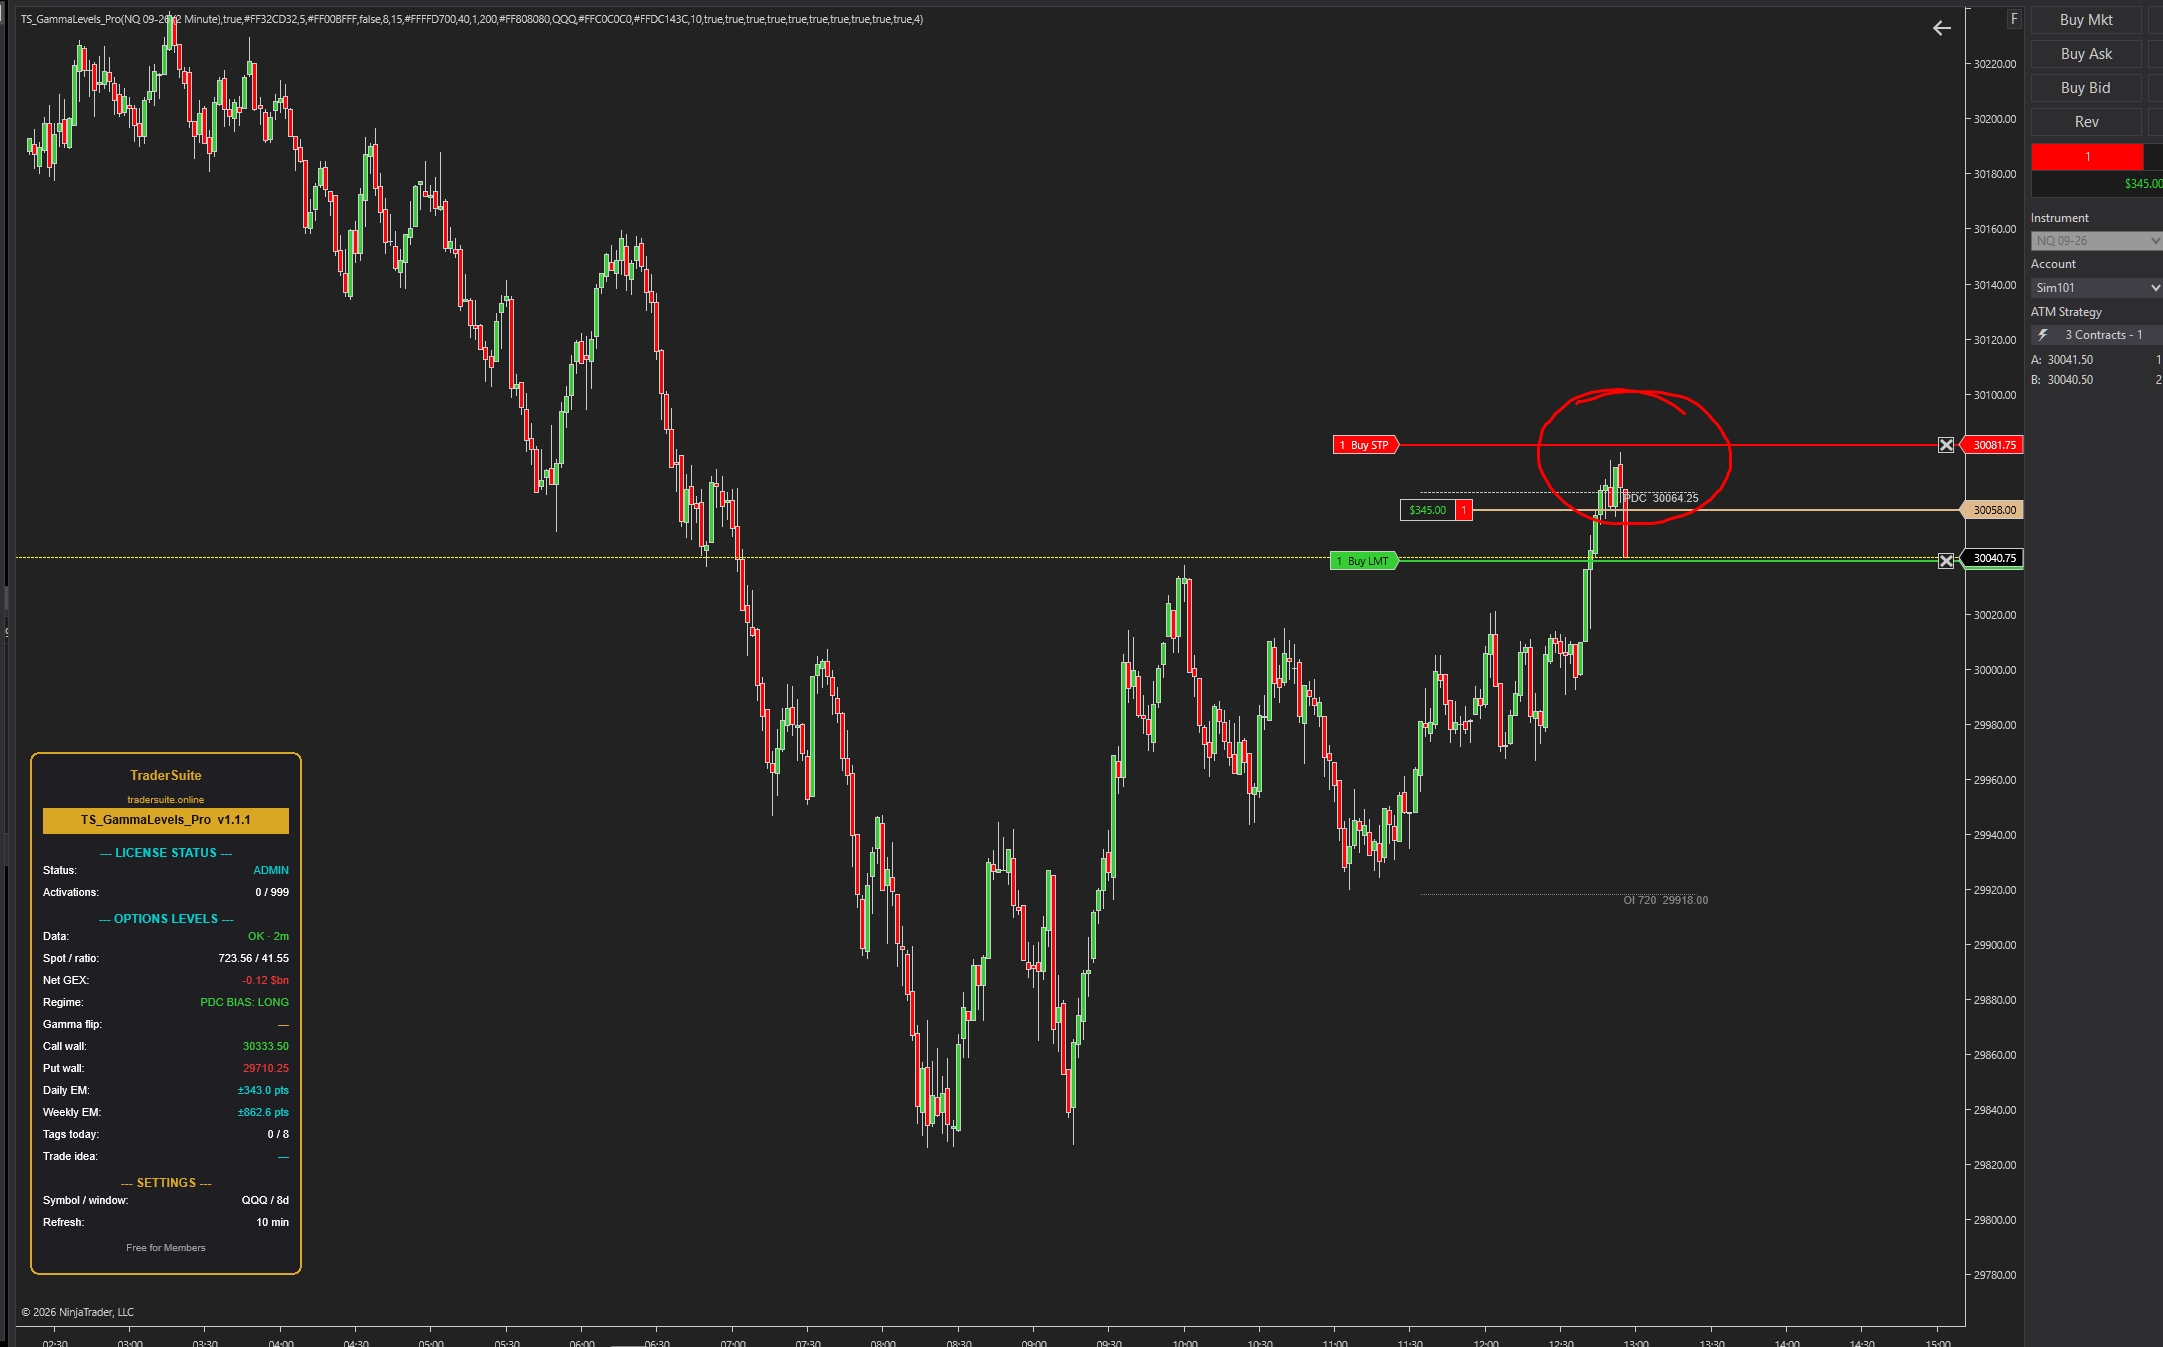
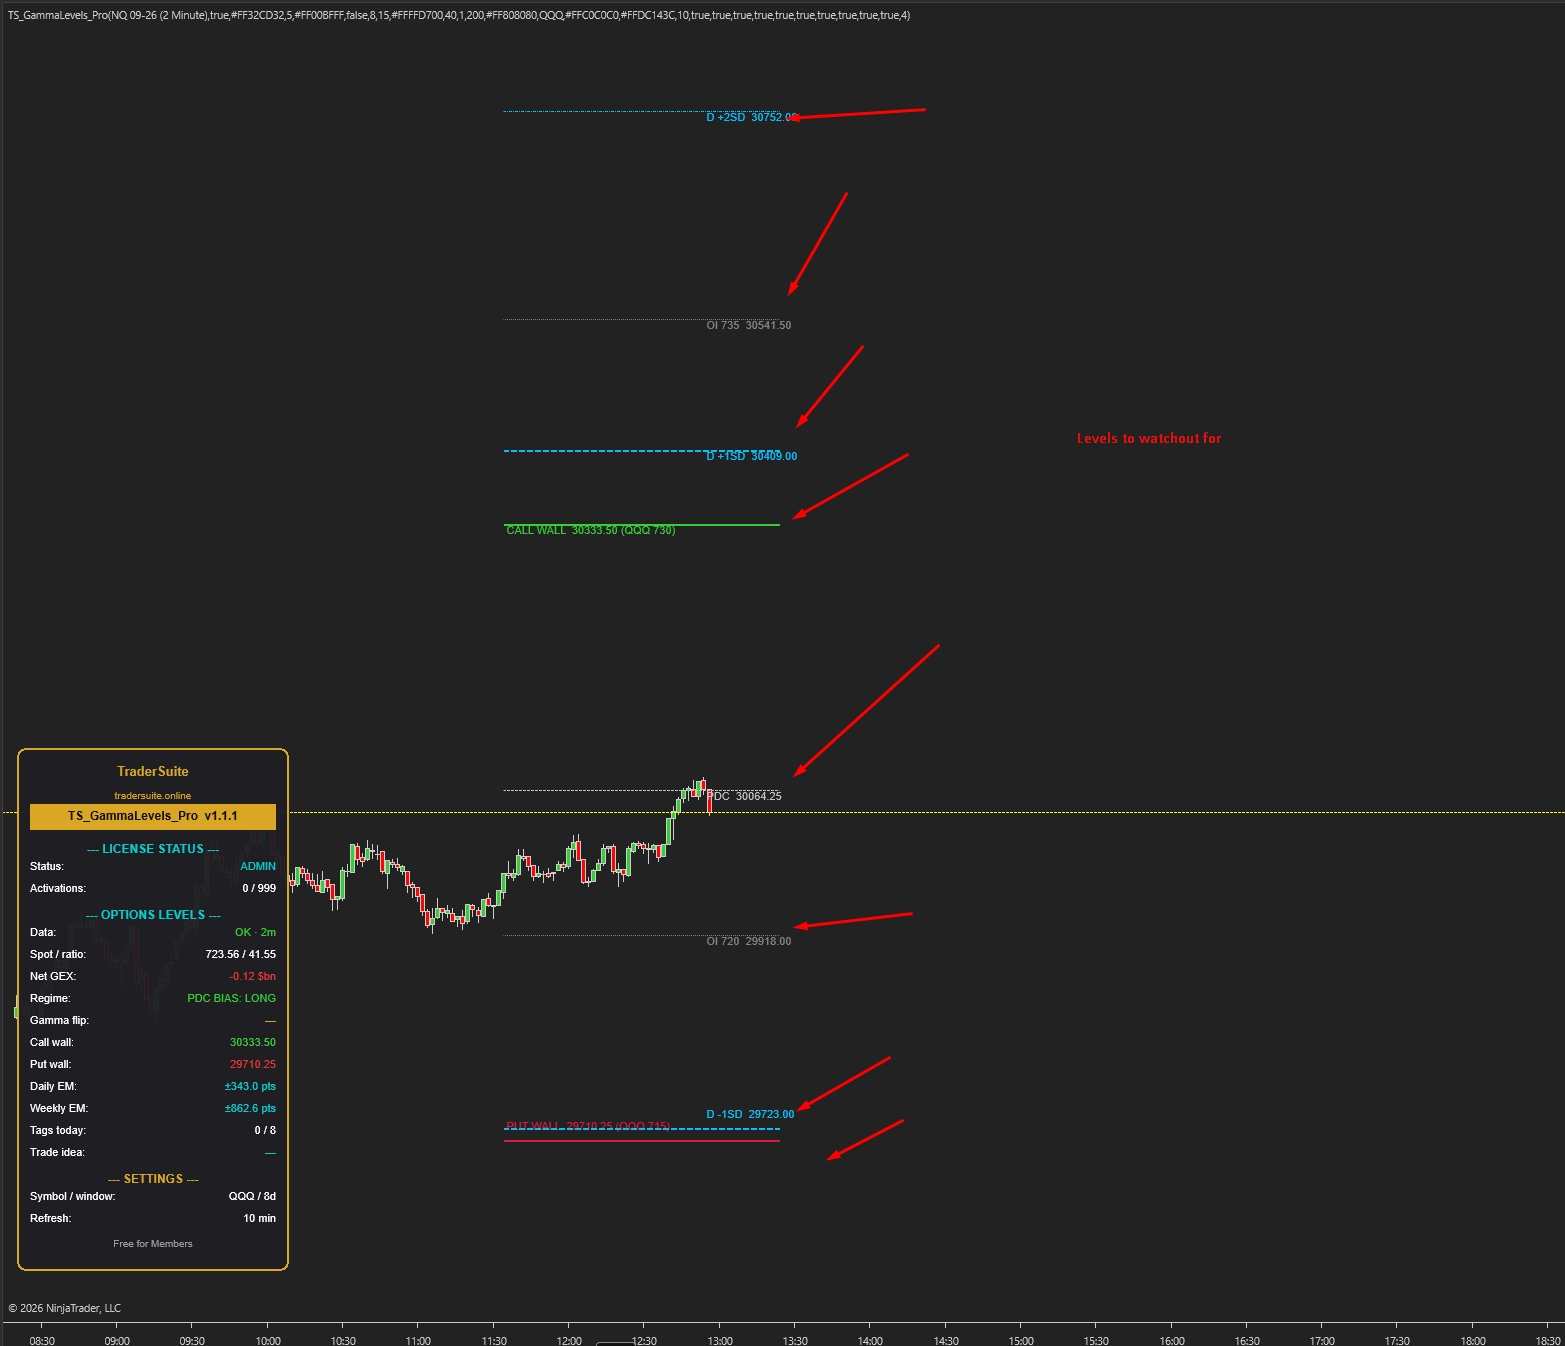
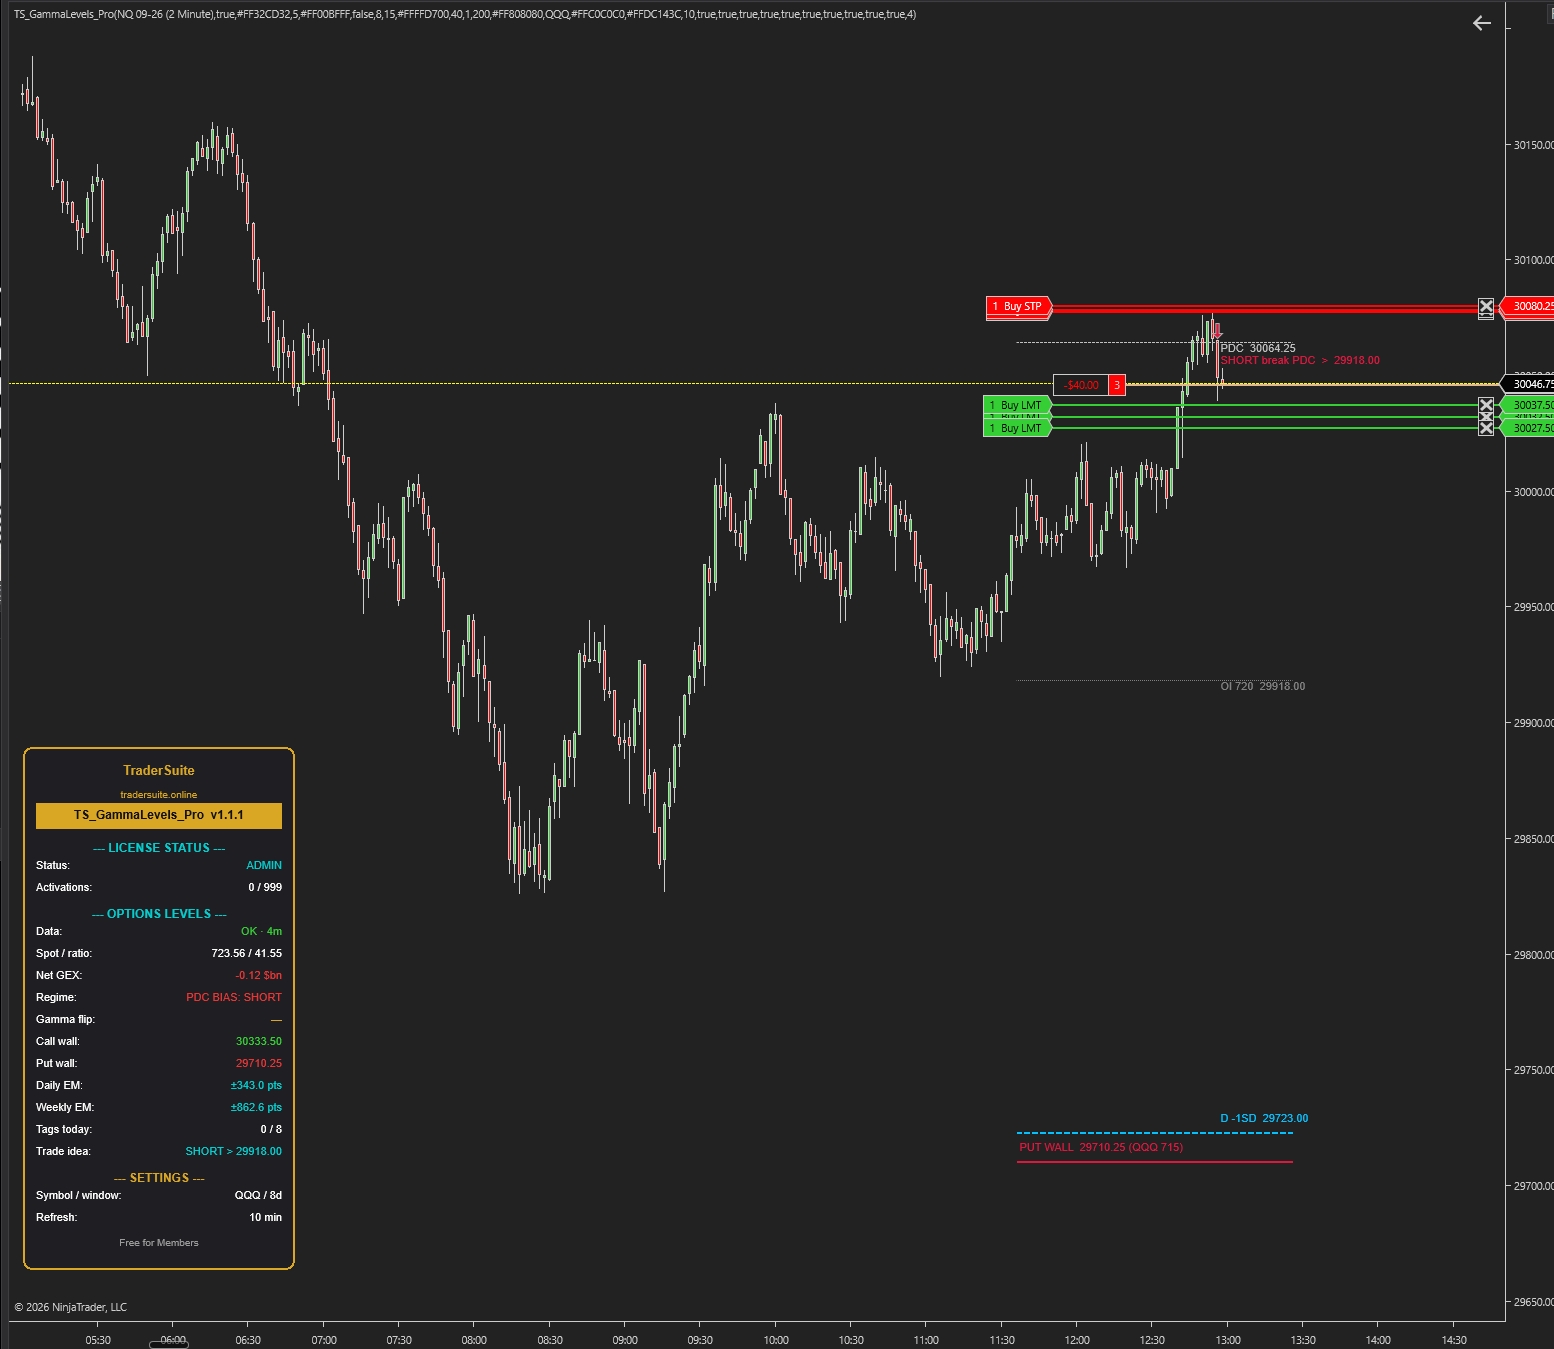
The level map — what every line means
All levels appear automatically within seconds of loading the chart and stay current all session. Here's a typical NQ morning:
Vacuum zones — read the gaps too
The spaces between levels matter as much as the levels. Where lines cluster tightly, price tends to grind. Where there's a wide empty gap between two levels, price can travel it fast — big candles, stop runs, little resistance. Plan size and stops accordingly: tighter risk when entering near a wide gap, because if the level behind you fails there's nothing to slow the move.
Two kinds of days — trade them differently
The panel's Regime row is the first thing to check every session. It tells you which playbook applies today.
POS GAMMA — "fade" days
Price is above the GEX Flip. Institutional hedging works against moves: rallies get sold into resistance, dips get bought at support.
Tactics: range trading works. Fade moves into the daily edges and walls, take profits early, expect chop and mean reversion. Breakout trades disappoint more often.
NEG GAMMA — "trend" days
Price is below the GEX Flip. Hedging now amplifies moves: selling triggers more selling, rallies can squeeze violently.
Tactics: respect momentum. Don't fade breakouts of the daily edges — a clean break can run to ±2SD. Use smaller size, wider expectations, faster decisions.
The regime can flip mid-session — there's an optional alert for exactly that moment, because the day's character often changes with it.
The session playbook
The indicator gives you the map. These five habits turn the map into decisions. Levels are decision zones — not automatic buy/sell signals.
Morning read: locate price on the map
Before your first trade, answer three questions from the chart and panel: Which regime? Where is price relative to the daily band? What's the nearest untagged level above and below? That's your bias and your two candidate destinations.
Trade toward untagged levels, not away from them
Prefer entries in the direction of the nearest major untagged level, ideally on pullbacks to a closer support level — not chasing. The level gives you the target before you ever click.
React at levels — don't pre-trade them
When price arrives at a wall or band edge, watch the reaction: rejection candles favor the bounce; acceptance (closes beyond, successful retest) favors continuation into the next zone. A reclaim after a failed break is a classic trap-reversal spot. Let the candles at the level decide.
Respect the regime for exits and stops
Positive gamma: take profits at the edges — moves die there more often. Negative gamma: trail instead of fading, and never add size inside a wide vacuum zone where a failed level means a fast run against you.
Let alerts and the Signal plot carry the load
Enable alerts for regime flips and boundary tags so you don't screen-watch. Automated traders can read the regime from the Signal output and switch tactics programmatically:
// +1 = positive-gamma regime, -1 = negative-gamma, 0 = no data yet
var gl = TS_GammaLevels_Pro(/* your parameters */);
if (gl.Signal[0] == 1)  UseMeanReversionTactics();
else if (gl.Signal[0] == -1) UseMomentumTactics();
Do
- Check the regime row before your first trade, every session.
- Use walls and band edges as profit targets — book into them, not after them.
- Wait for reactions (rejection or acceptance) at levels before committing.
- Reduce size in vacuum zones and on negative-gamma days.
- Pair it with TS_MeasuredMove_Pro — a measured-move target landing on a wall is strong confluence.
Don't
- Don't short "because it's high" while an upside level sits untagged above.
- Don't fade breakouts on negative-gamma days — that's spiral fuel.
- Don't treat a level touch as an automatic entry — levels are zones to make decisions at.
- Don't add size just because the level is "close" — a failed level in a vacuum runs fast.
- Don't trade the map on holiday/half sessions blindly — thin volume weakens every level.
Reading the panel
Bottom-left of the chart — your one-glance session summary.
Installation & the settings that matter
Install in 3 steps
1) NinjaTrader 8 → Tools → Import → NinjaScript Add-On. 2) Add TS_GammaLevels_Pro to your NQ chart — levels appear within seconds. 3) The 7-day free trial starts automatically; after purchase, enter your key under 0A. License. An internet connection is required (the data updates itself).
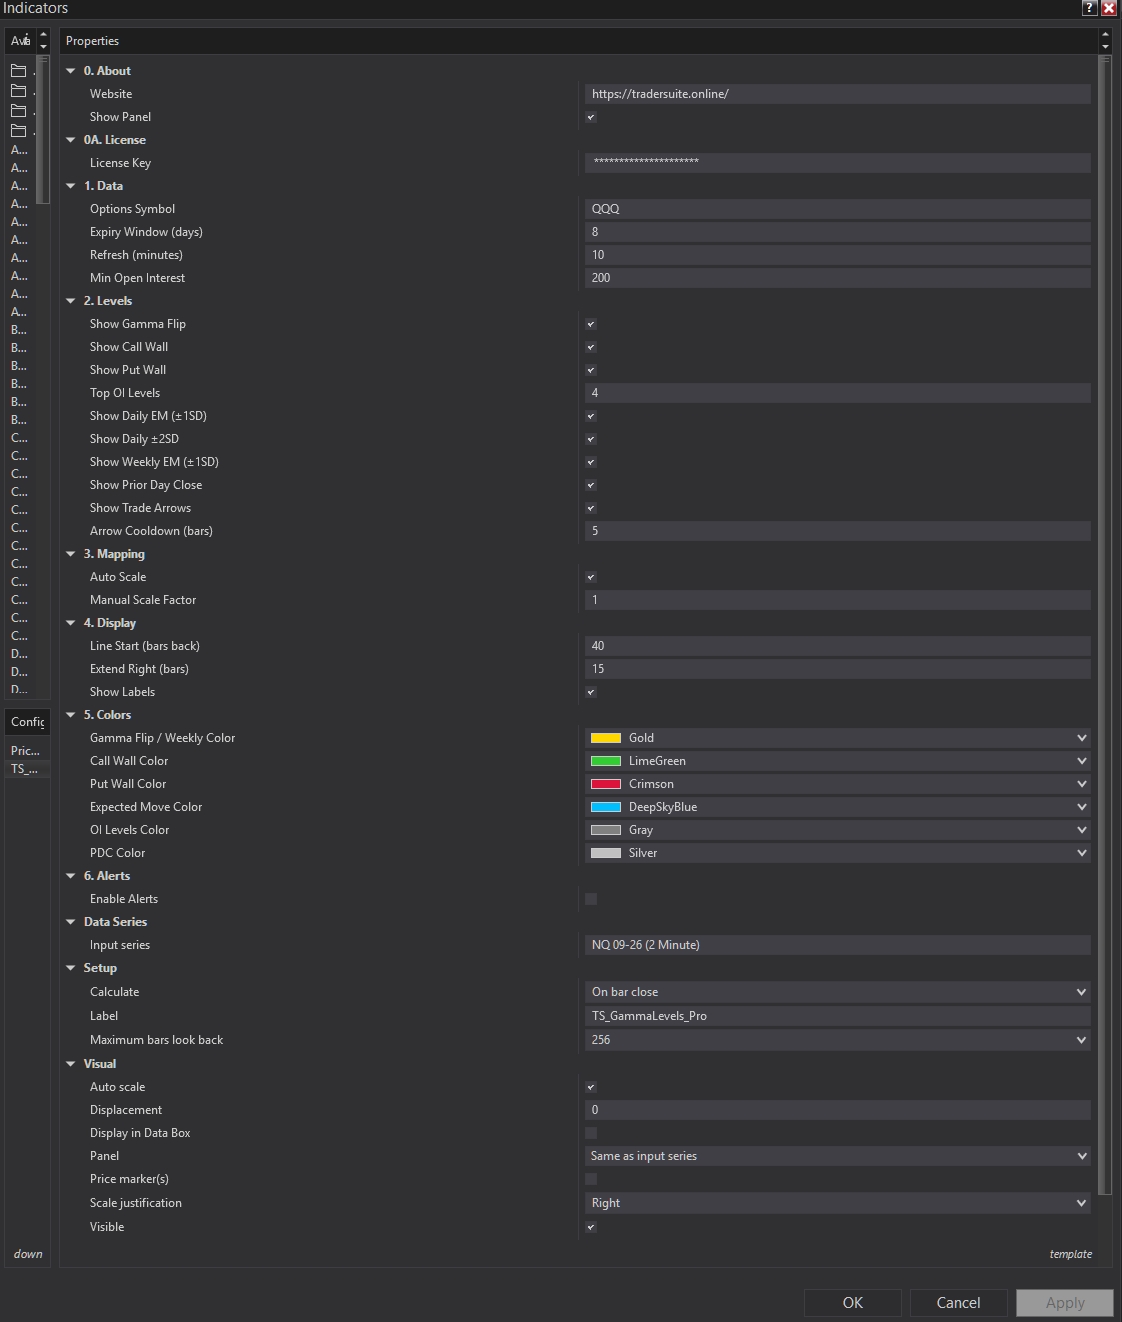
Options Symbol
The only setting most users ever change — match it to your chart using the instruments table above.
Refresh (minutes)
How often levels re-sync. 10 minutes suits intraday trading; there's no benefit going below 5.
Level toggles
Show/hide each family: daily band, ±2SD extensions, weekly band, walls, flip, OI levels, PDC. Start with defaults; hide OI levels if the chart feels busy.
Top OI Levels
How many secondary positioning strikes to draw. 0 for a minimal chart, up to 10 for a dense map.
Auto Scale
Converts levels to your chart's prices automatically. Leave on for futures; it's ~1:1 on ETF charts anyway.
Alerts
Turn on for regime flips and daily/weekly boundary tags — the three highest-value moments to be notified about.
FAQ
Do the levels repaint or move around during the day?
Levels only adjust at the scheduled refresh (default every 10 minutes), and normally by small amounts. They never repaint history — what you saw is what was drawn. Weekly levels are very stable; daily levels tighten slightly as the session progresses.
Why are my levels slightly different from another service's numbers?
Every provider blends positioning data a little differently and maps it to futures with different reference prices, so small offsets are normal. What matters is behavior around the zone, not tick-exact agreement. Treat every level as a zone a few points wide.
Is this a buy/sell signal indicator?
No — it's a market map. It tells you where reactions are likely and what kind of day you're in. Your entry trigger (price action, order flow, or another TraderSuite tool) decides the trade; this decides the location and the target.
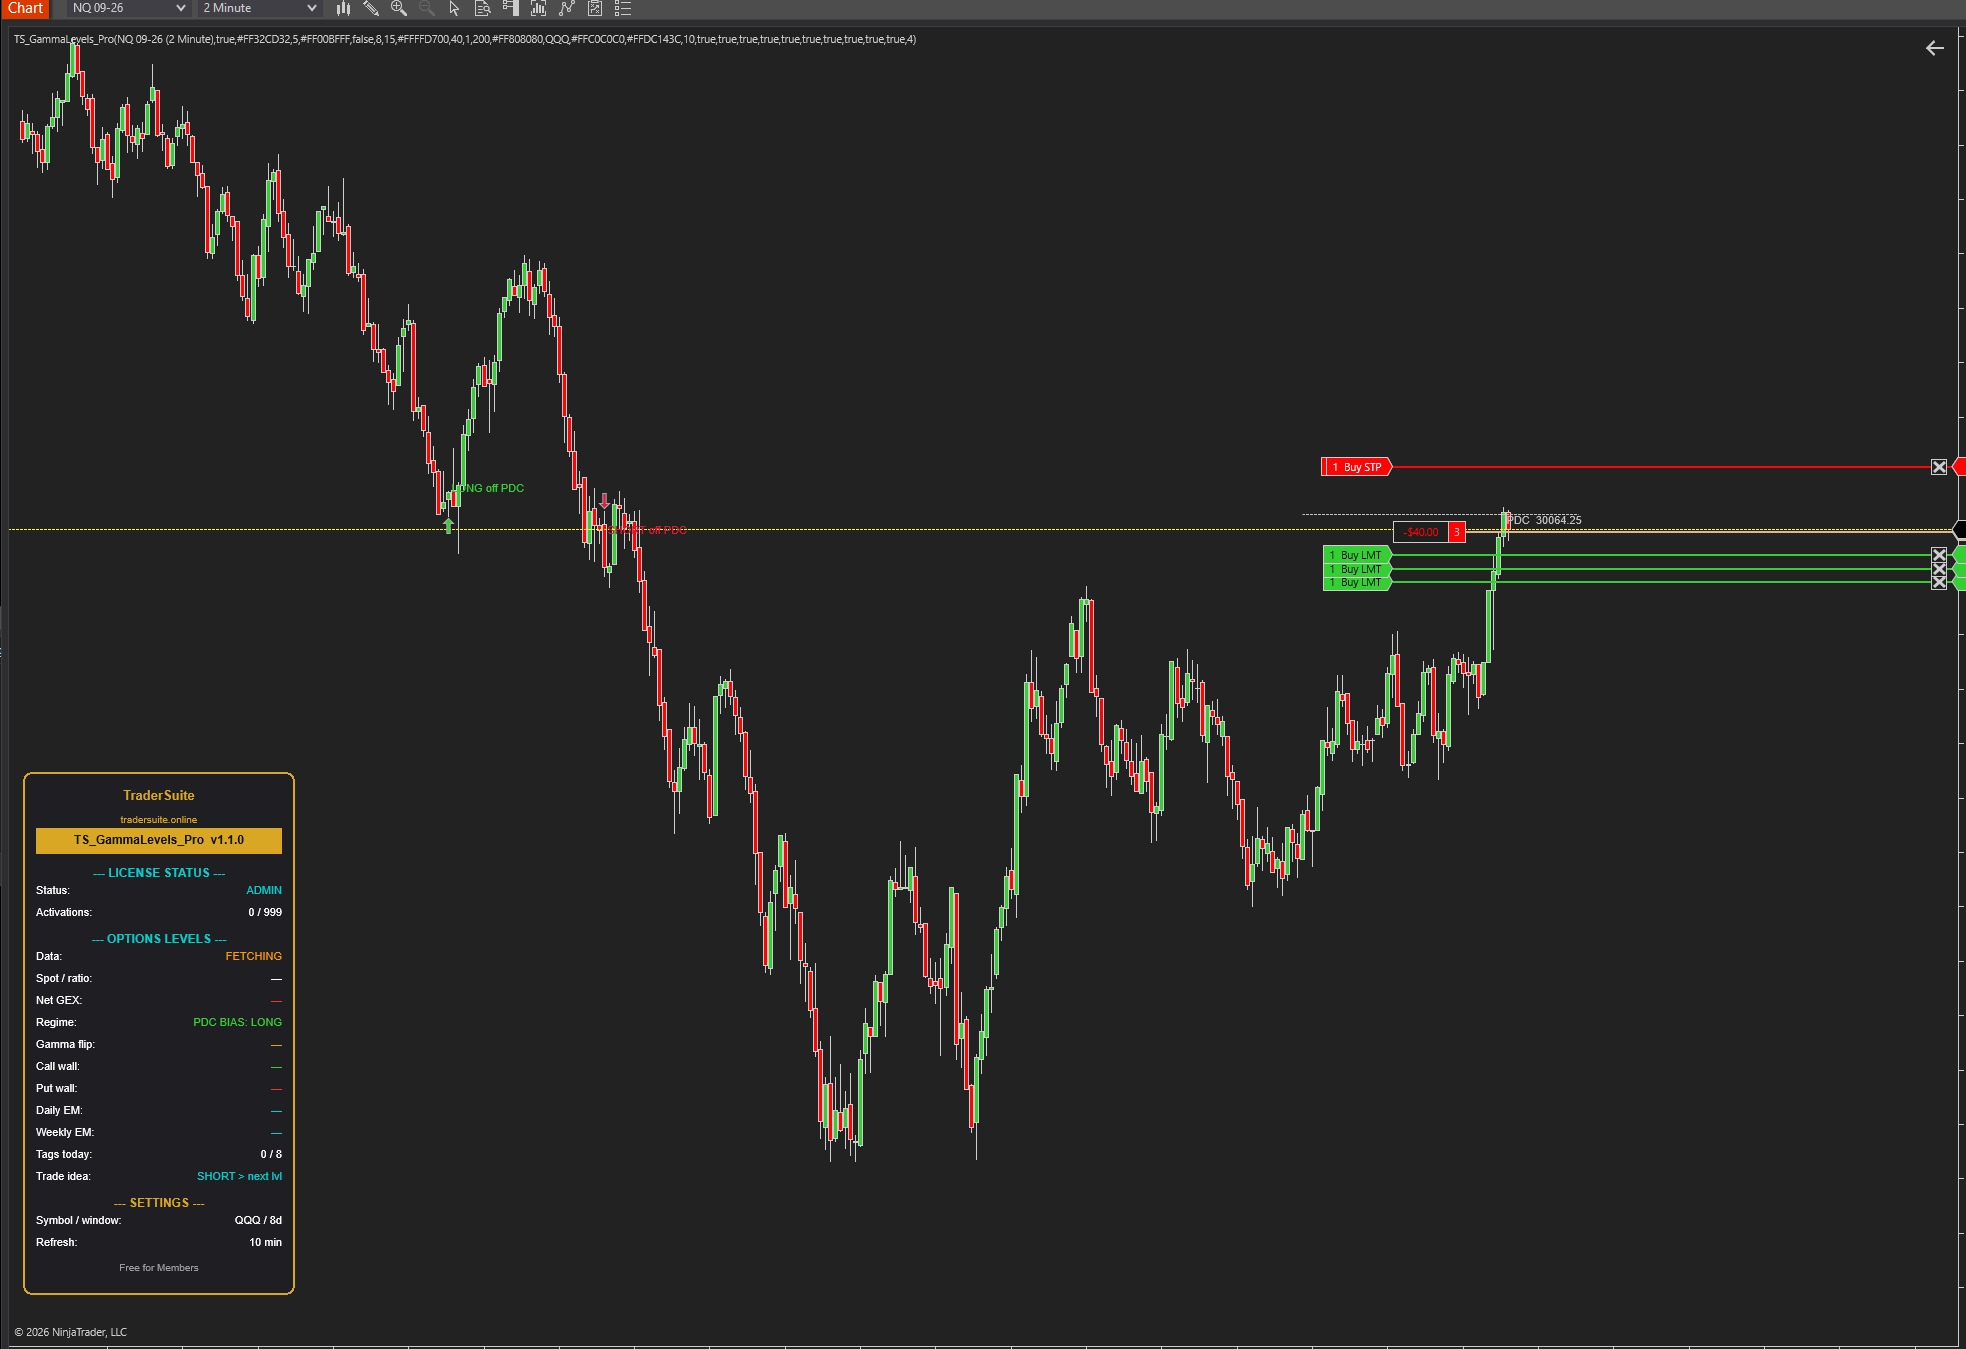
Nothing shows up when I load the chart — why?
Give it a few seconds — the first data sync happens right after the chart loads (the panel Data row shows FETCHING, then OK). If it shows ERROR, check your internet connection and that the Options Symbol is a valid, liquid ETF like QQQ or SPY.
Does it work overnight / in the Globex session?
Yes — levels stay on the chart around the clock. Keep in mind they're most influential during regular US trading hours when the options market is open and hedging is active; overnight respect is looser.
Which timeframe should I use?
The levels are the same on every timeframe — they're price-based, not bar-based. Most users trade them on 1–15 minute charts and keep a 15-minute chart for the big picture.
Can my automated strategy use it?
Yes — the Signal output publishes the current regime (+1 / −1) every bar, and alerts cover regime flips and boundary tags. See the code snippet in the Playbook section.
Holiday or half-day sessions?
The levels still draw, but thin-volume sessions respect every kind of level less. Reduce expectations and size accordingly — knowing when not to trade is part of using a map well.
Related Products
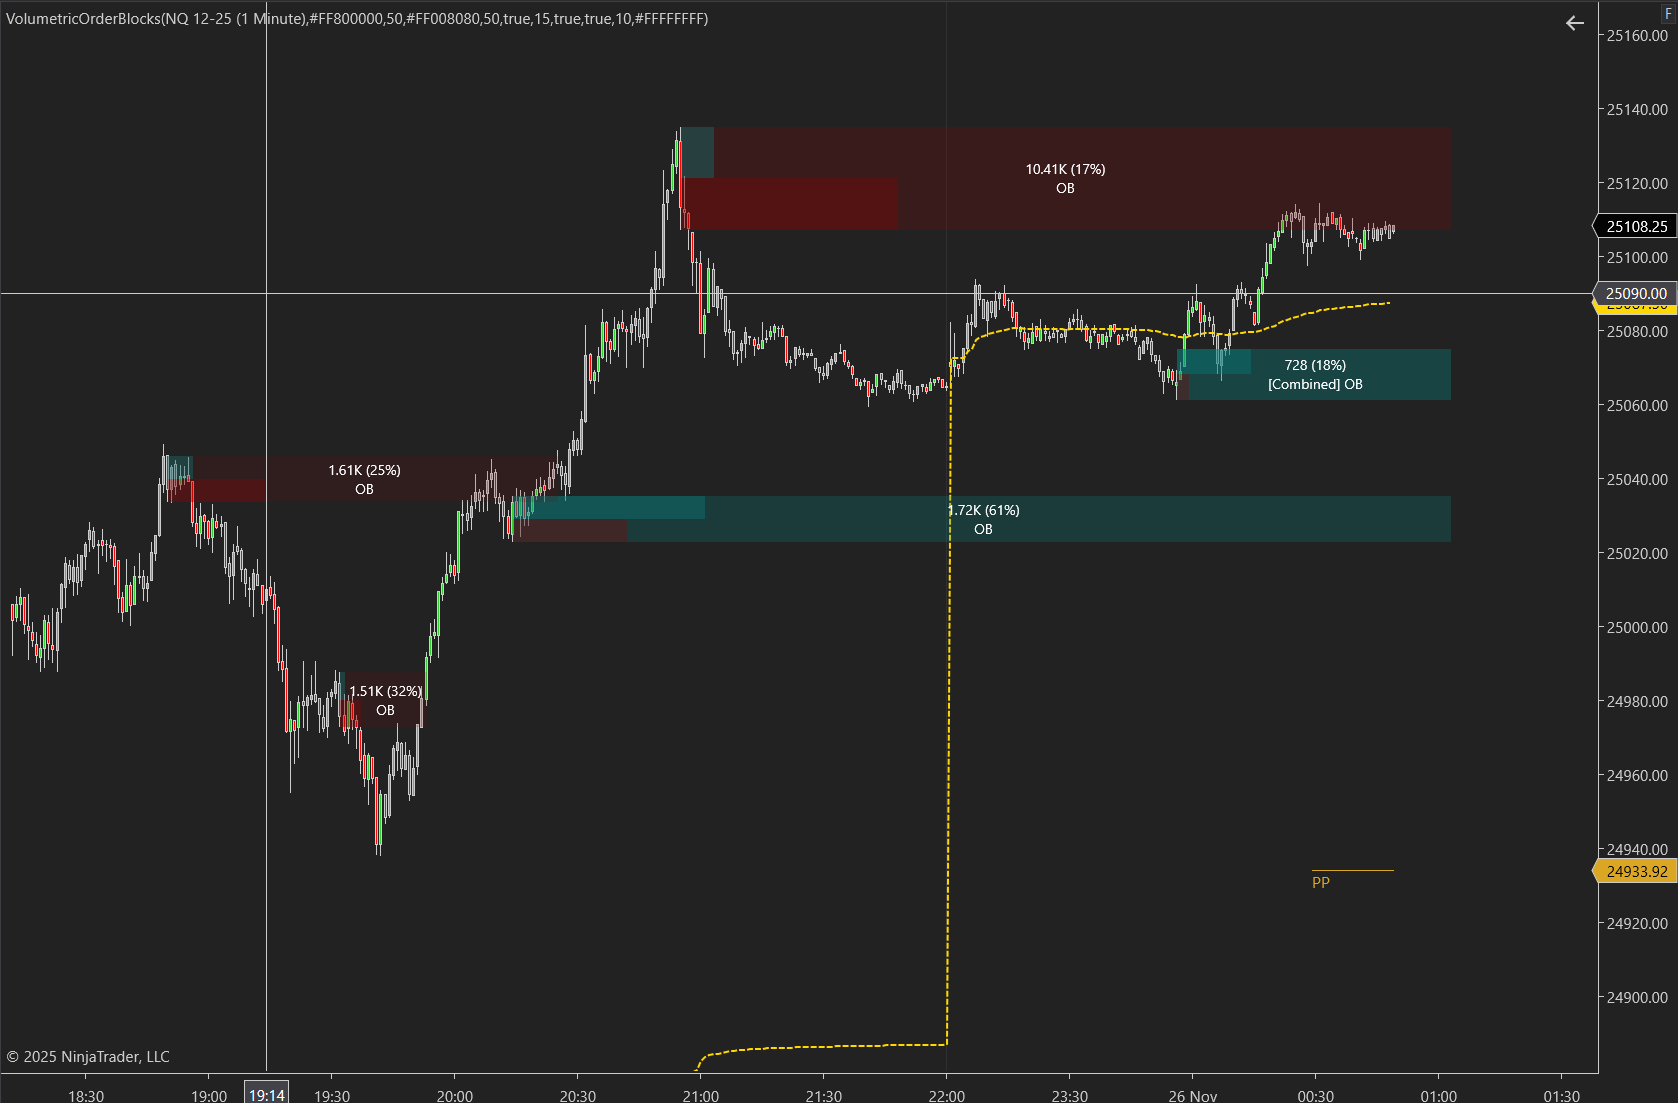
Volumetric Order Blocks Pro
Automatically detect institutional supply & demand zones with volume-weighted order blocks. Identify high-probability reversal zones where smart money is positioned.
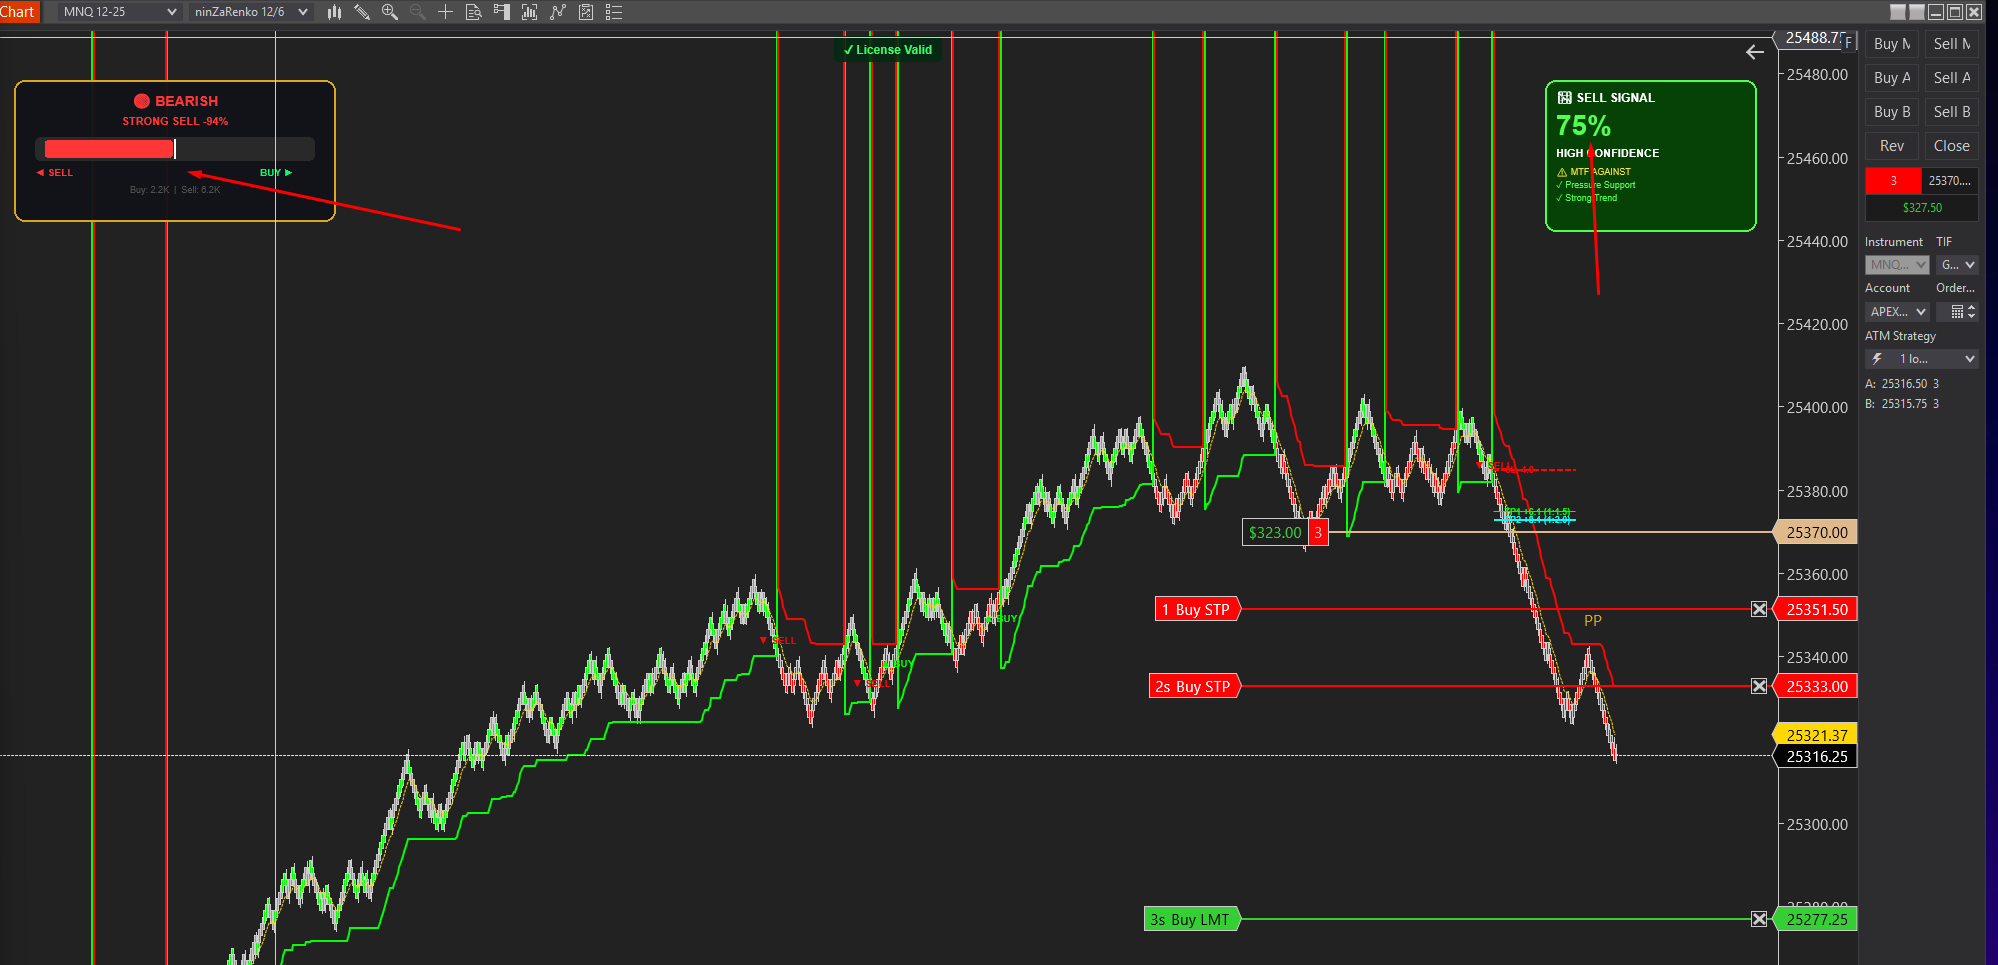
Smartflowpro
Advanced order flow analysis with real-time Pressure Delta Meter, multi-timeframe confluence scoring, and intelligent signal probability rating. Know who's in control before you trade.
UltraADXVolatilityWaves
Professional ADX-powered volatility zones indicator with dynamic Support/Resistance, Daily/Weekly levels, ATR-based TP/SL targets, and probability-scored signals. Identify high-probability reversal zones in real-time.
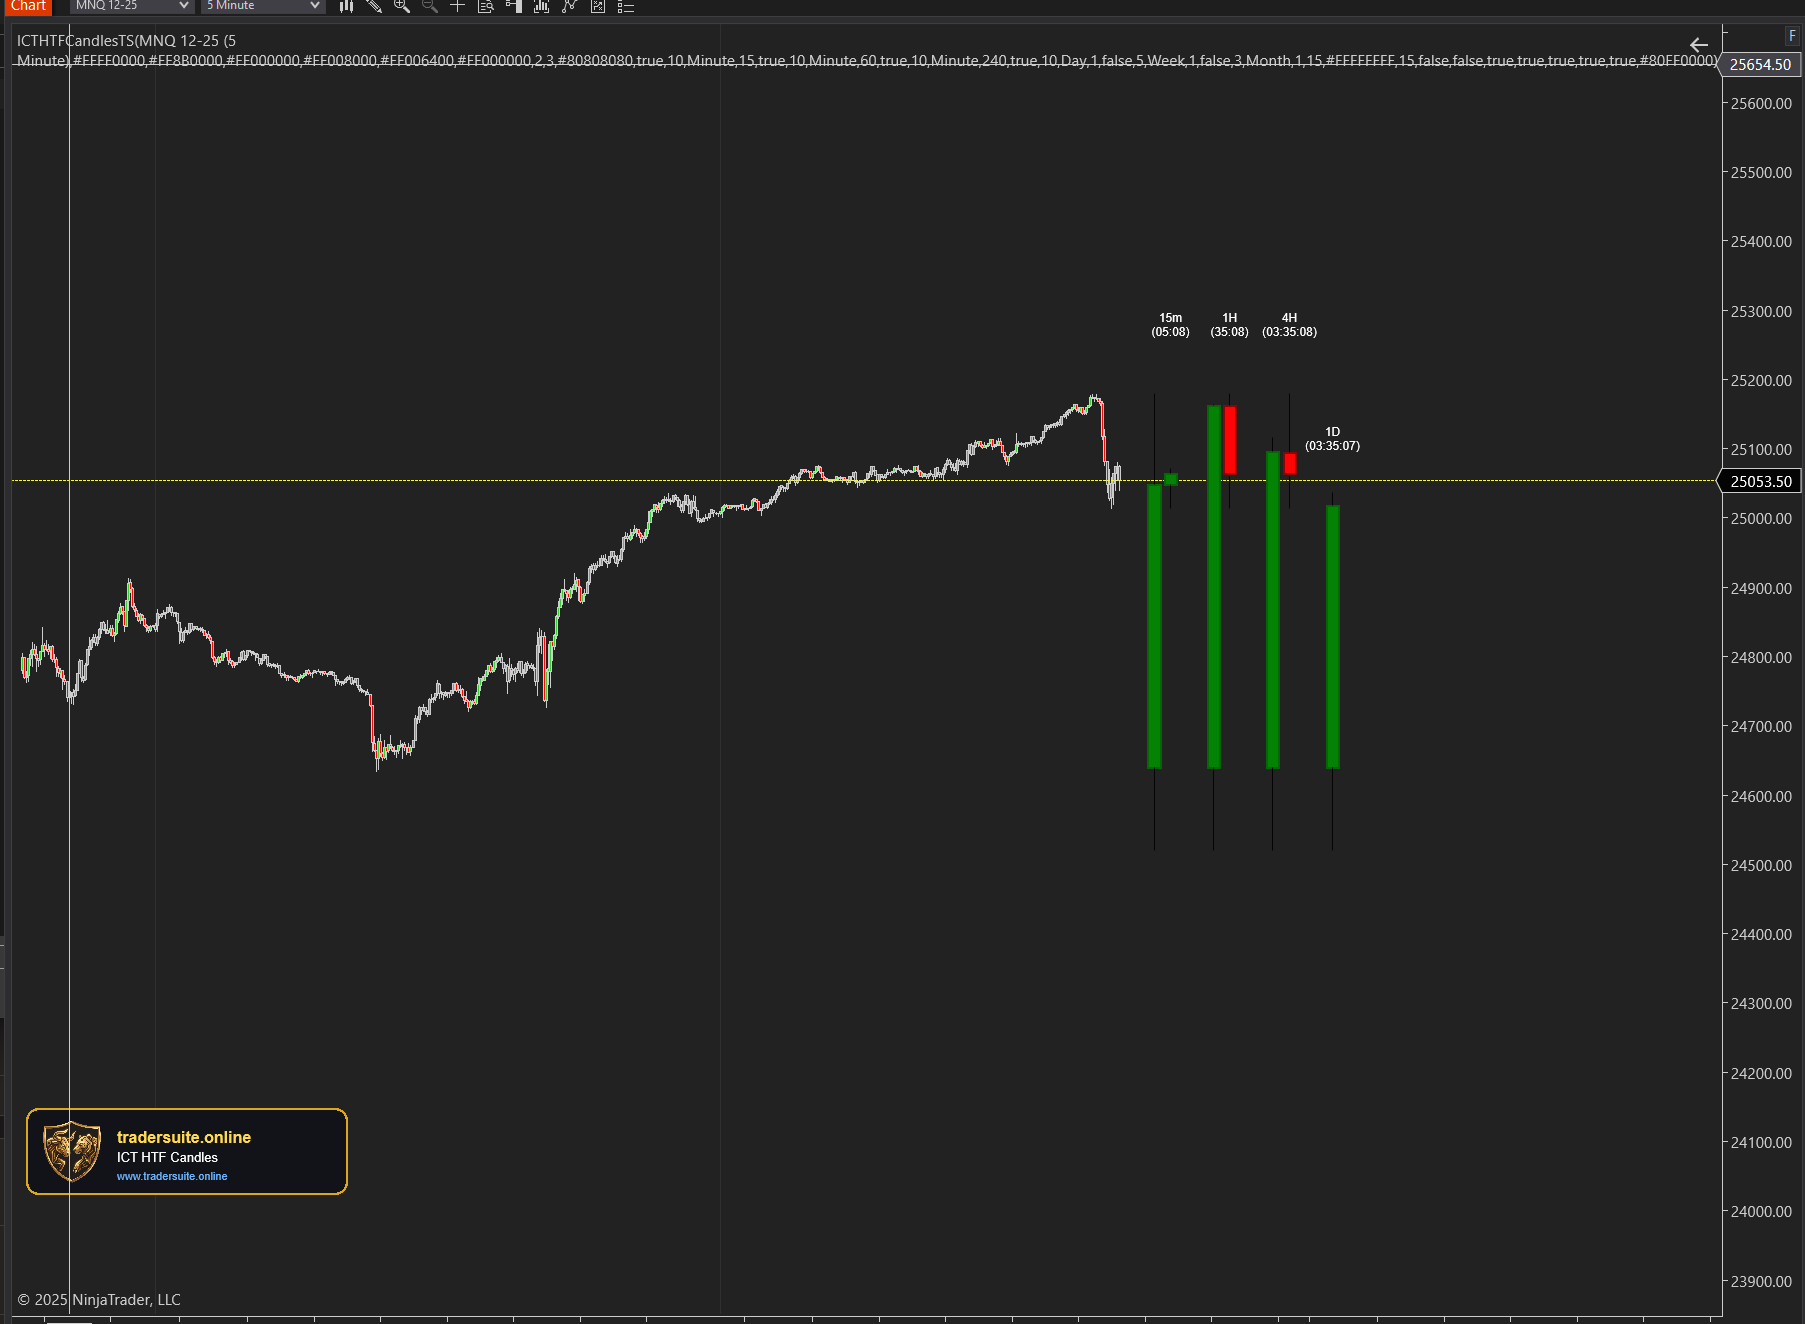
ICT HTF Candles Pro
Visualize multiple higher timeframe candles directly on your chart with real-time countdown timers, Fair Value Gap detection, and Volume Imbalance highlighting. Perfect for ICT traders who need multi-timeframe confluence without switching charts.
