TS Trend Exhaustion
Two Williams %R lines mark when a trend is stretched. When the stretch ends, get a clear TURN or RE-JOIN signal with a stop and two targets drawn for you. NinjaTrader 8, closed bars, no repaint.
Secure download
Instant access
Lifetime updates
Free forever
2 activations
Per licence
Documentation
Step-by-step guides
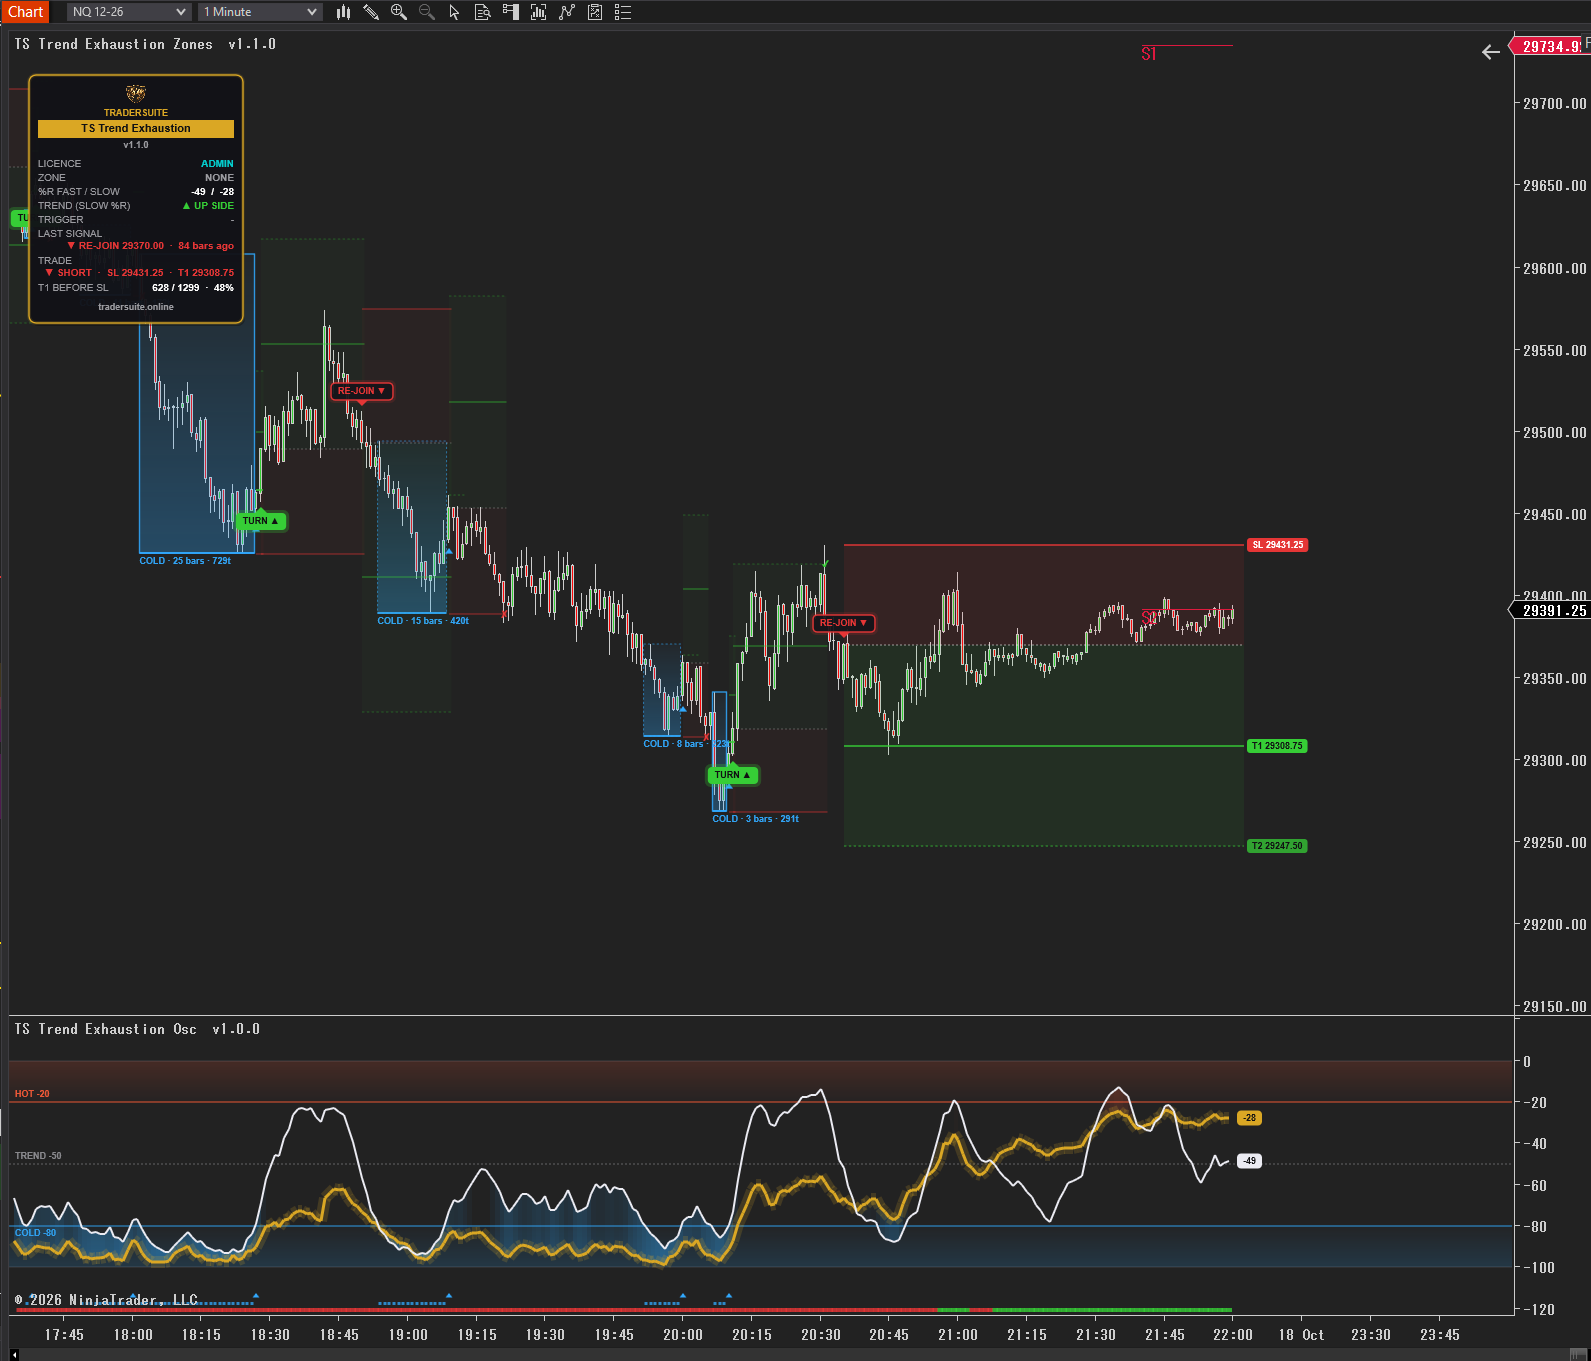
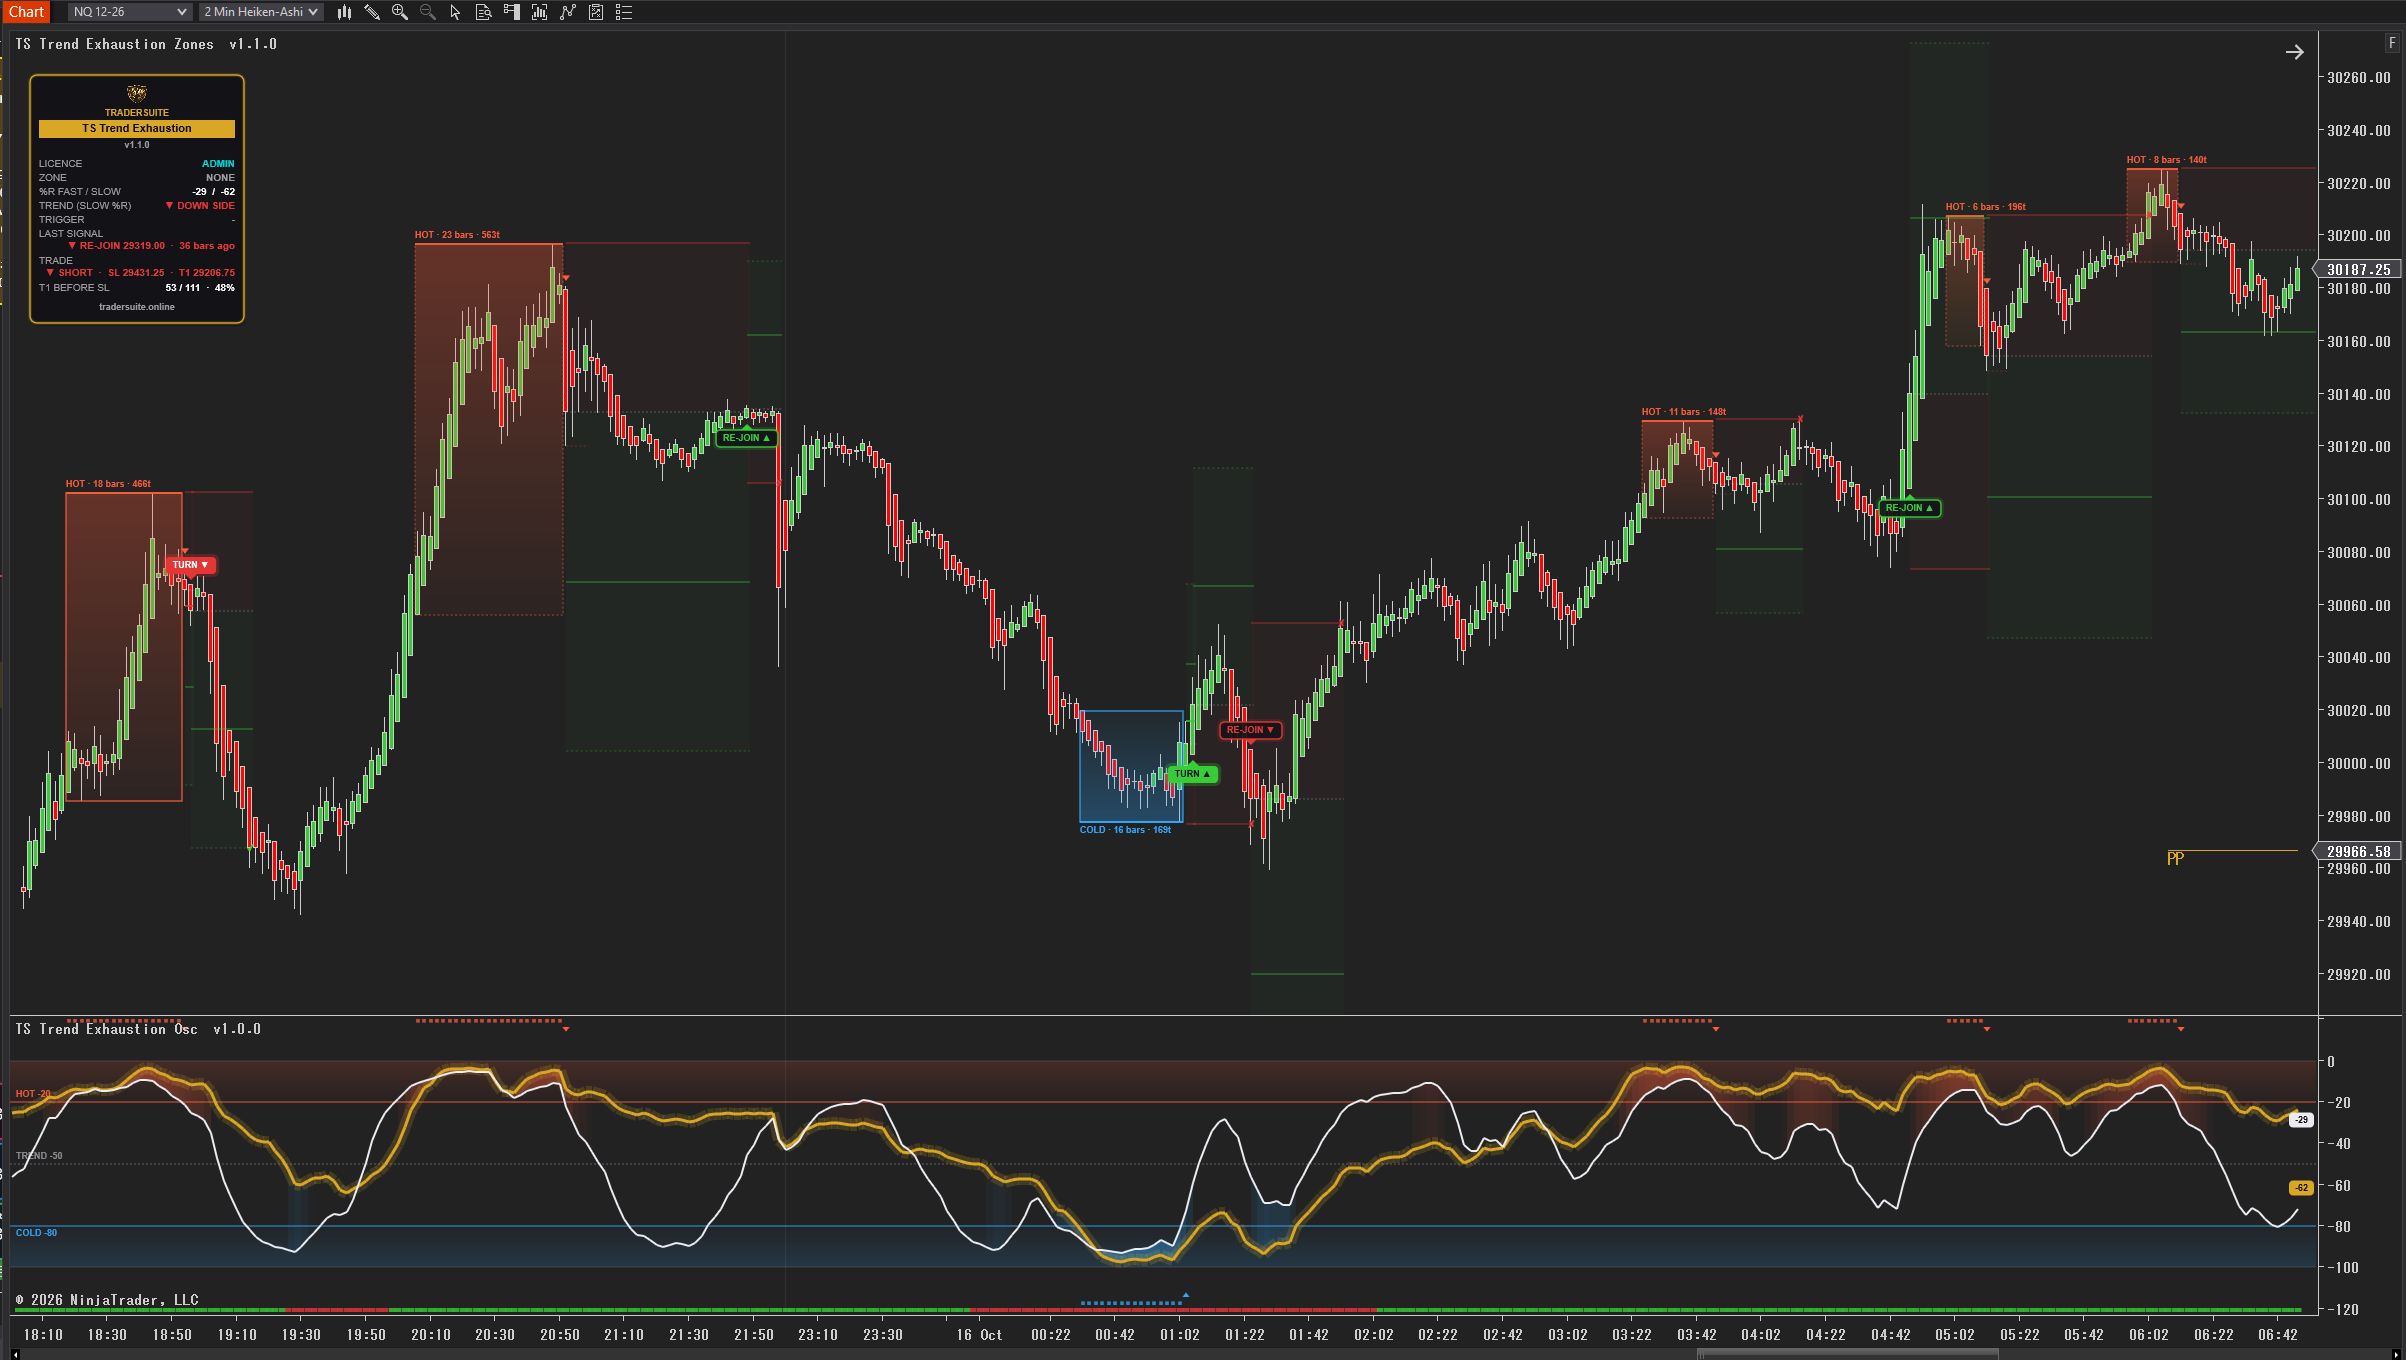
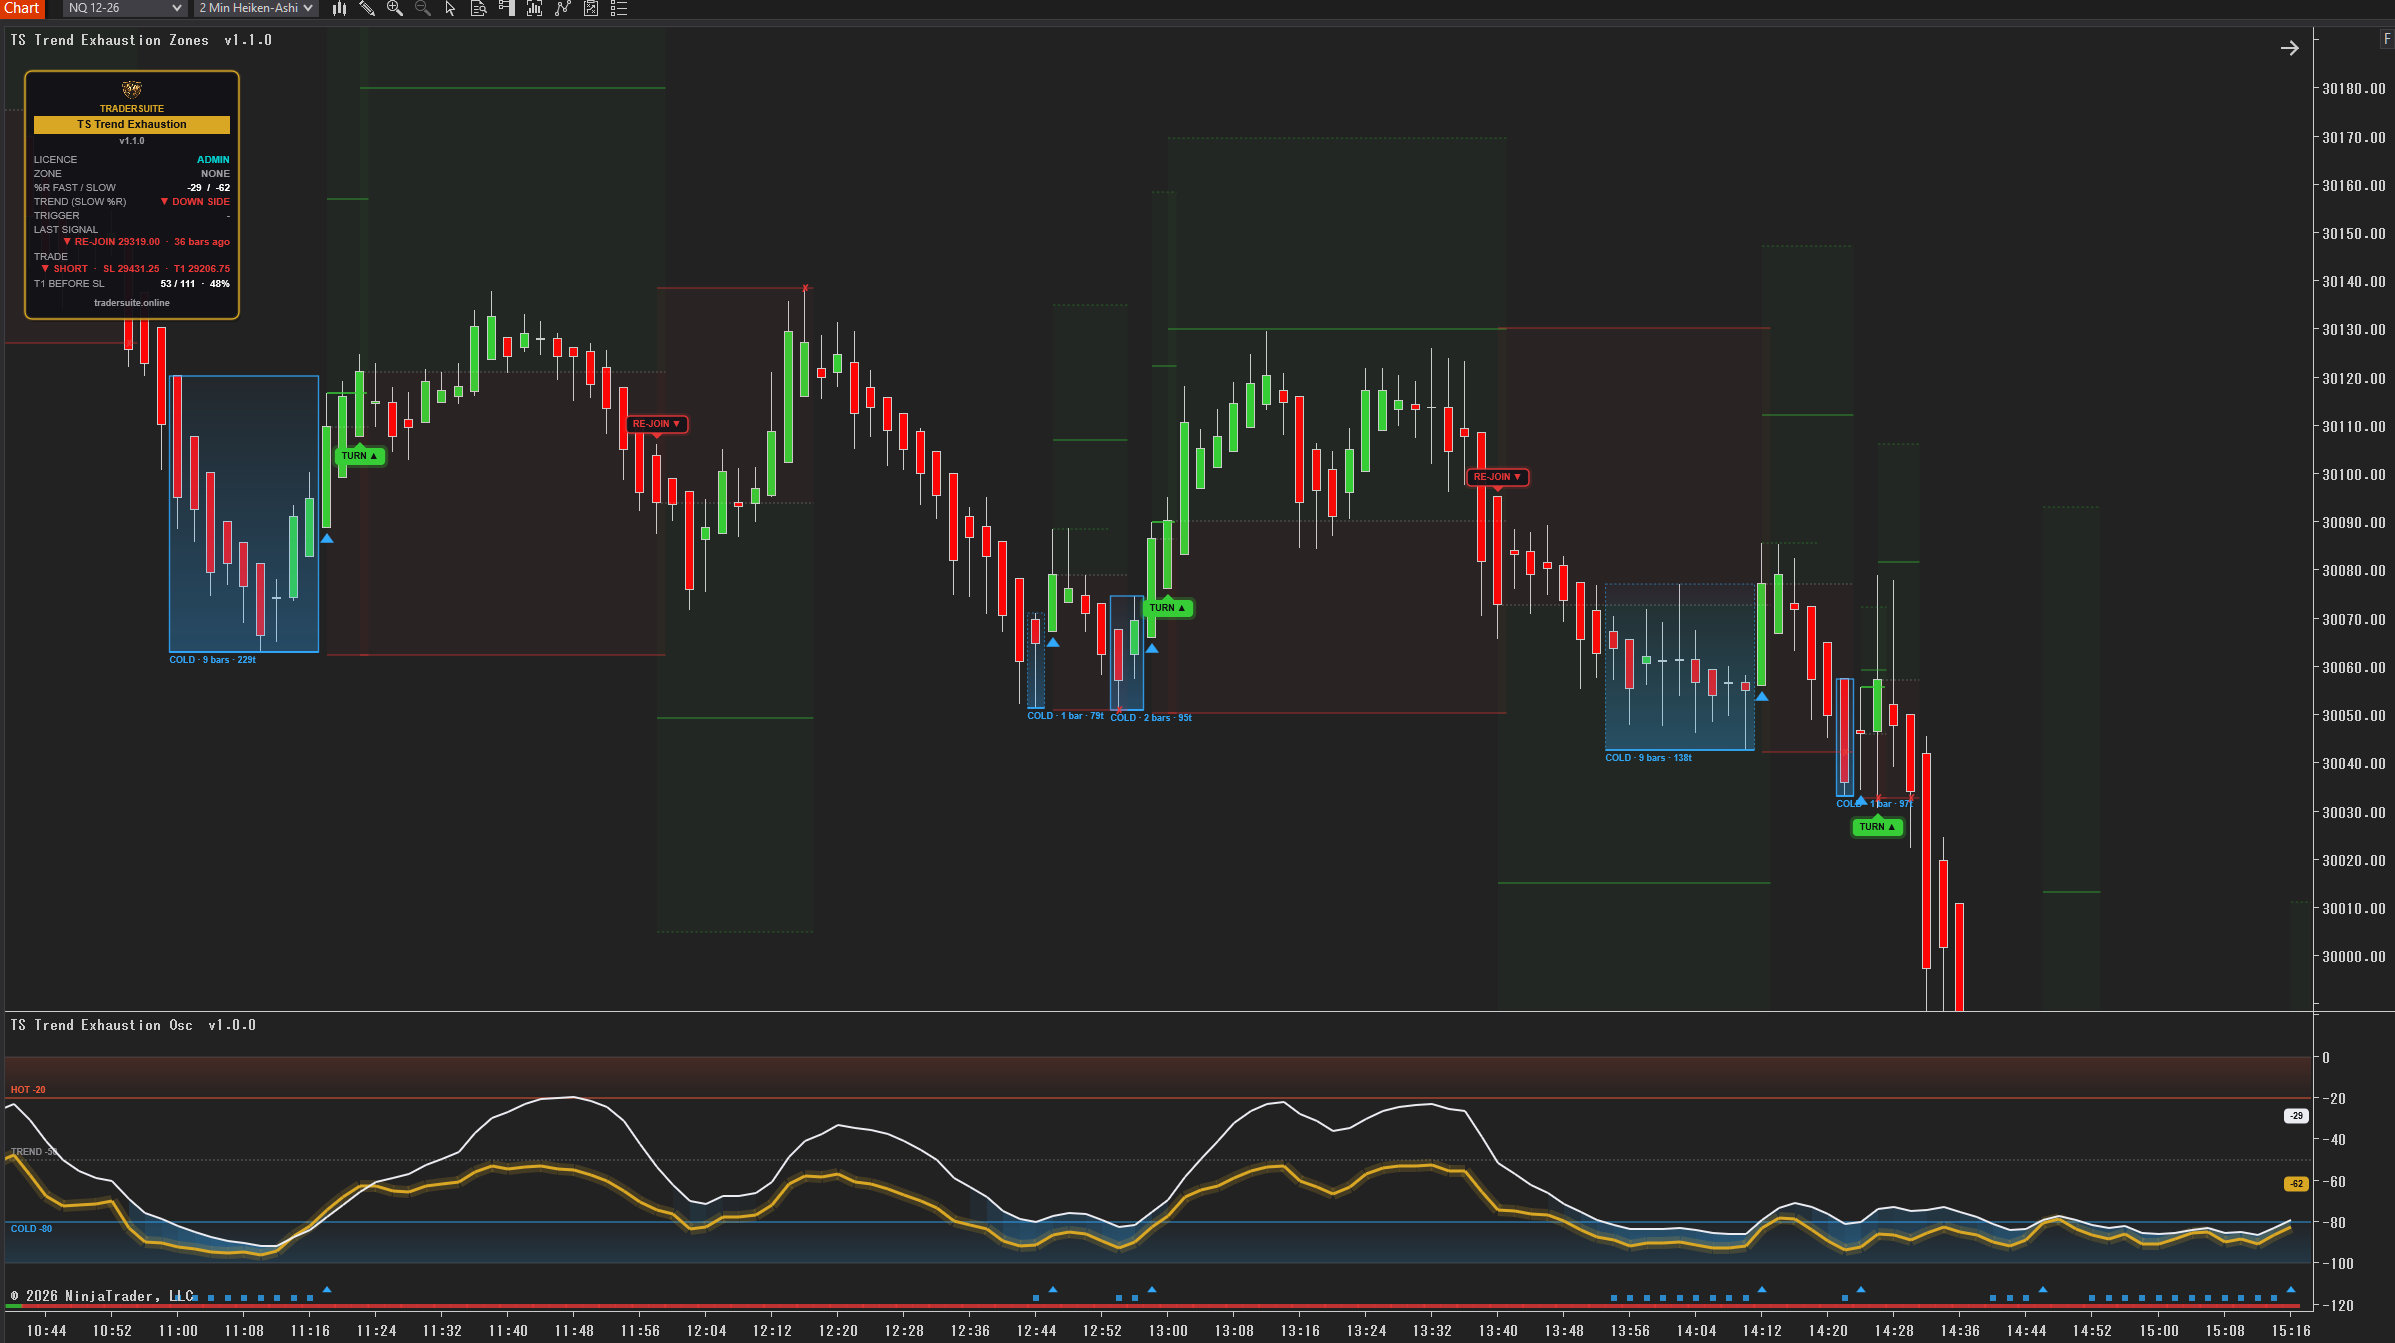
TS Trend Exhaustion shows you when a trend is stretched, and what happens when that stretch ends.
It watches two Williams %R lines: a fast line (21 bars) and a slow line (112 bars). When both sit near the top of their range, the trend is HOT. When both sit near the bottom, it is COLD. A box grows around those candles, so you can see the stretch at a glance.
Two signals, one clear plan
- TURN – the zone ends and price closes through the trigger line within 3 bars. The stretched move has started to turn.
- RE-JOIN – price pulls back, but the slow line holds its side of -50. When the fast line crosses back, the trend has re-joined.
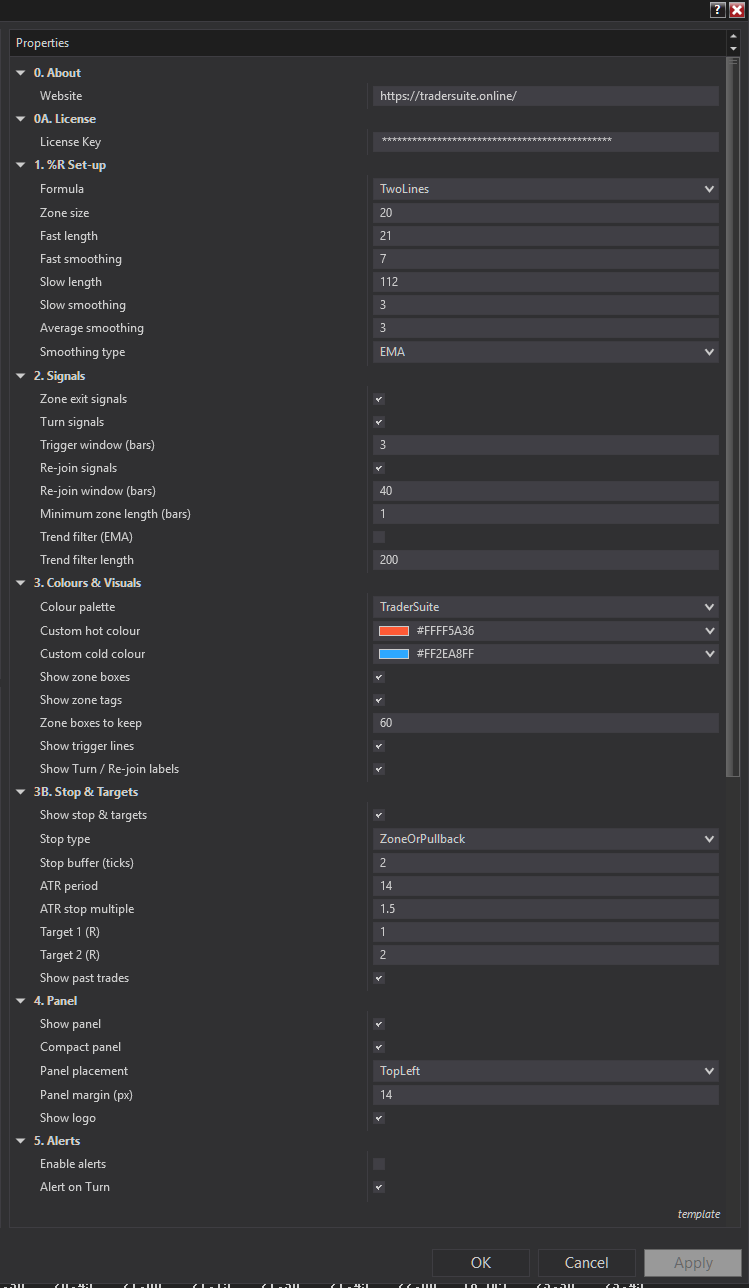
Every signal comes with a stop and two targets drawn on the chart. For a TURN the stop goes just beyond the zone box. For a RE-JOIN it goes just beyond the pullback. Target 1 is 1× your risk and Target 2 is 2× your risk. You can switch to an ATR stop if you prefer.
Built to be honest
Signals are worked out on closed bars only, so nothing repaints. The panel shows the zone, both %R values, the trend side, the waiting trigger and the current trade. Alerts tell you when a TURN or RE-JOIN prints, so you don't have to watch every bar.
Two parts install together as one package: TS_TrendExhaustion_Zones on the price chart and TS_TrendExhaustion_Osc in its own panel underneath. Both load from their own TS_Trend_Exhaust folder in the Indicators list and use one licence key.
This is a tool to help you read the trend, not a promise of profit. Practise on a simulator first.
Product Demo
Related products
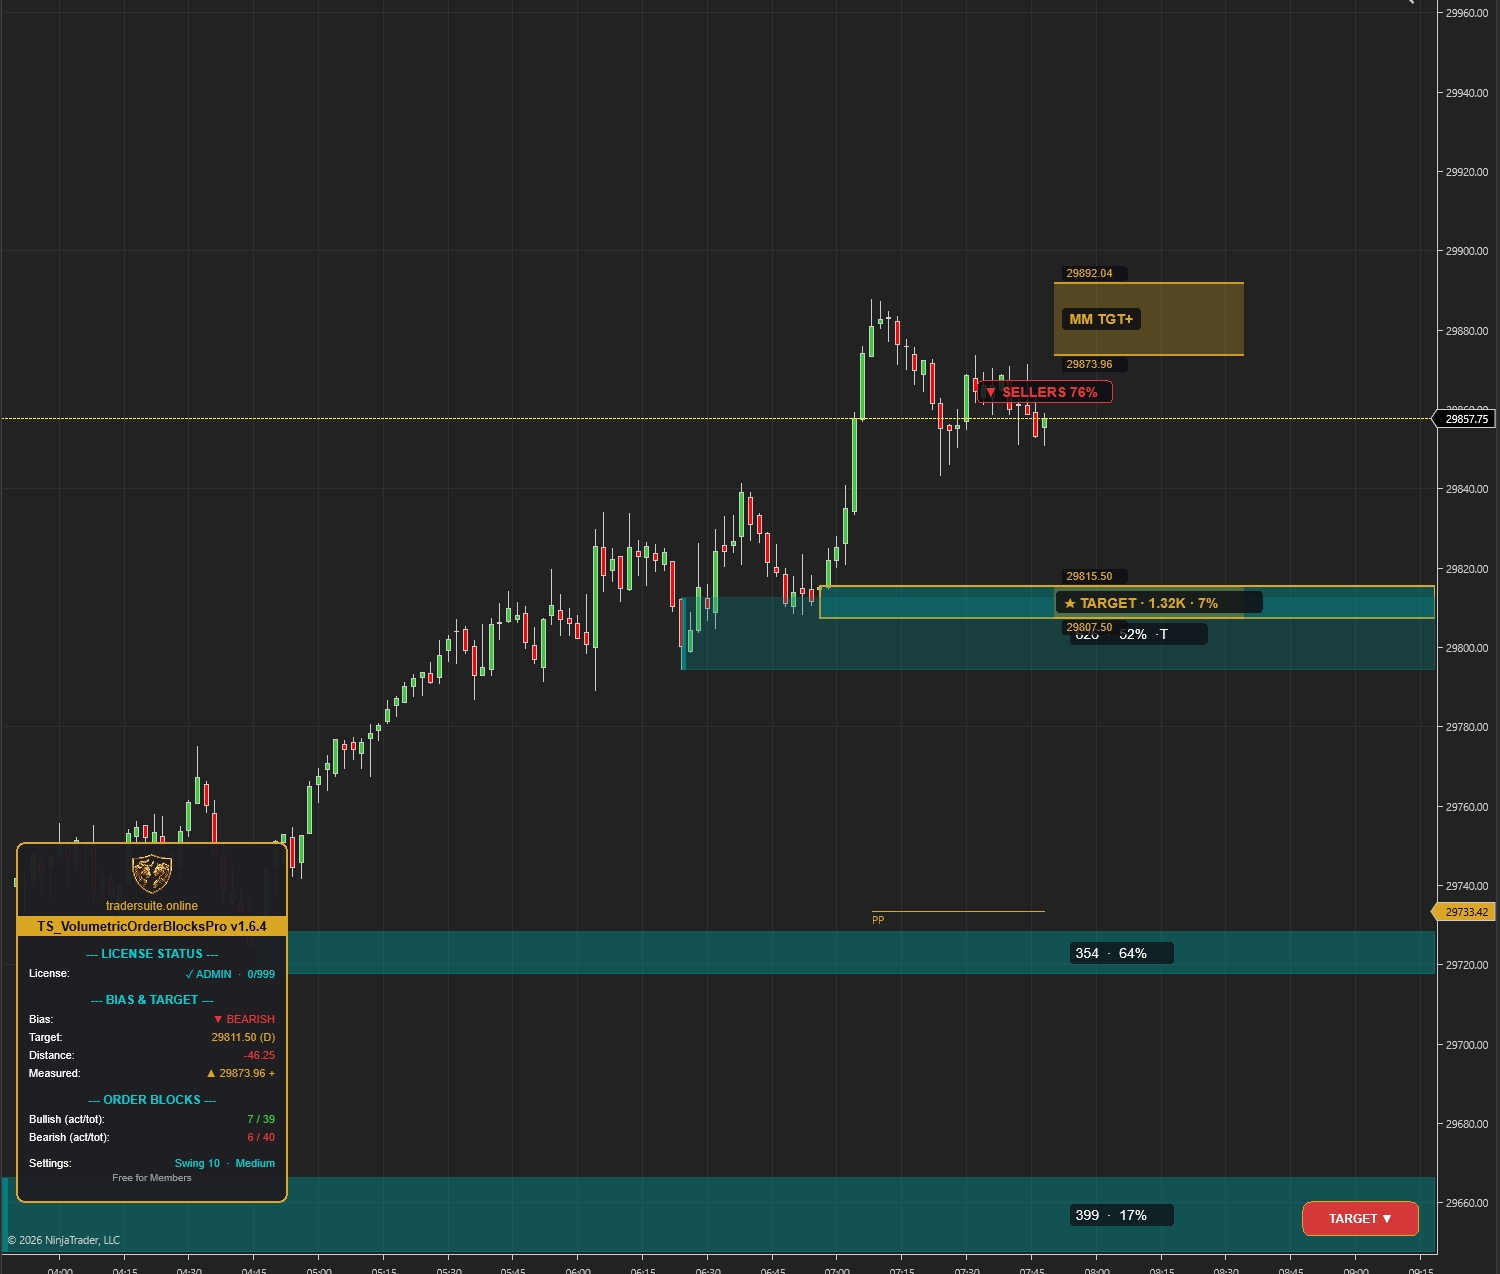
Volumetric Order Blocks Pro
Automatically detect institutional supply & demand zones with volume-weighted order blocks. Identify potential reversal zones where smart money is positioned.
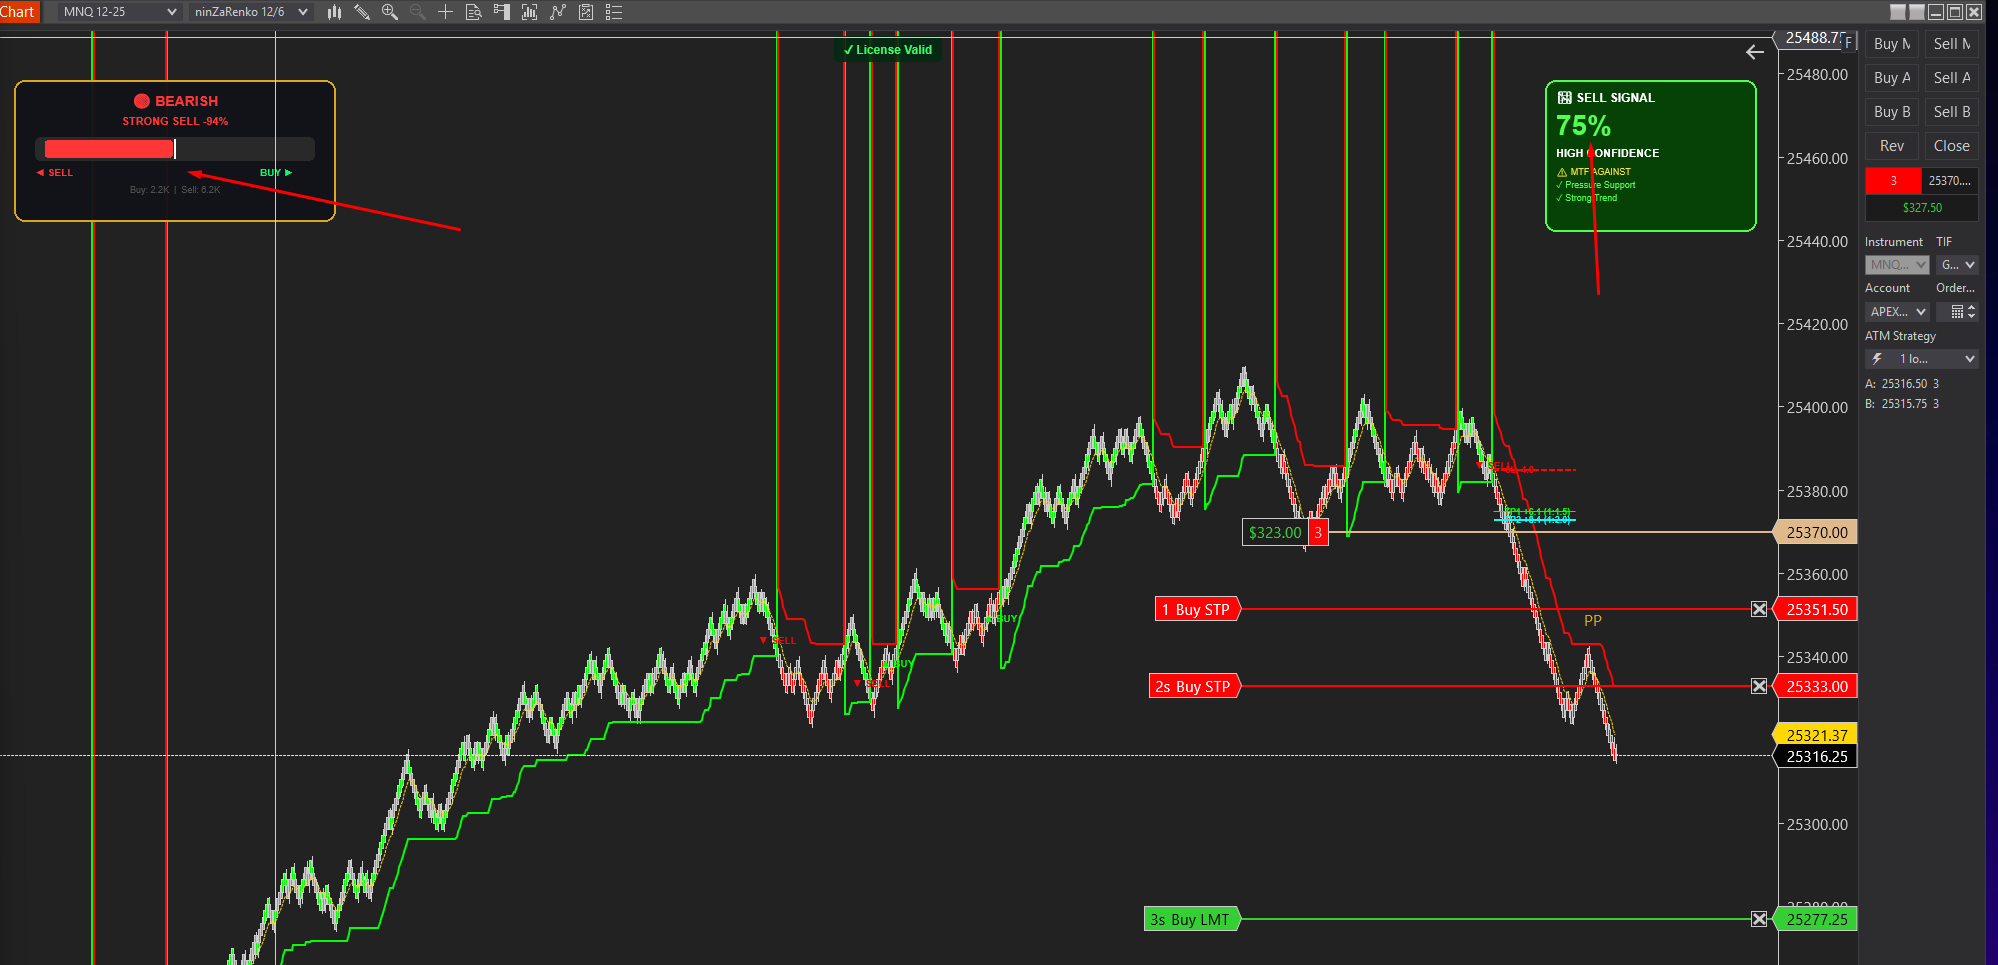
Smartflowpro
Advanced order flow analysis with real-time Pressure Delta Meter, multi-timeframe confluence scoring, and intelligent signal probability rating. Know who's in control before you trade.
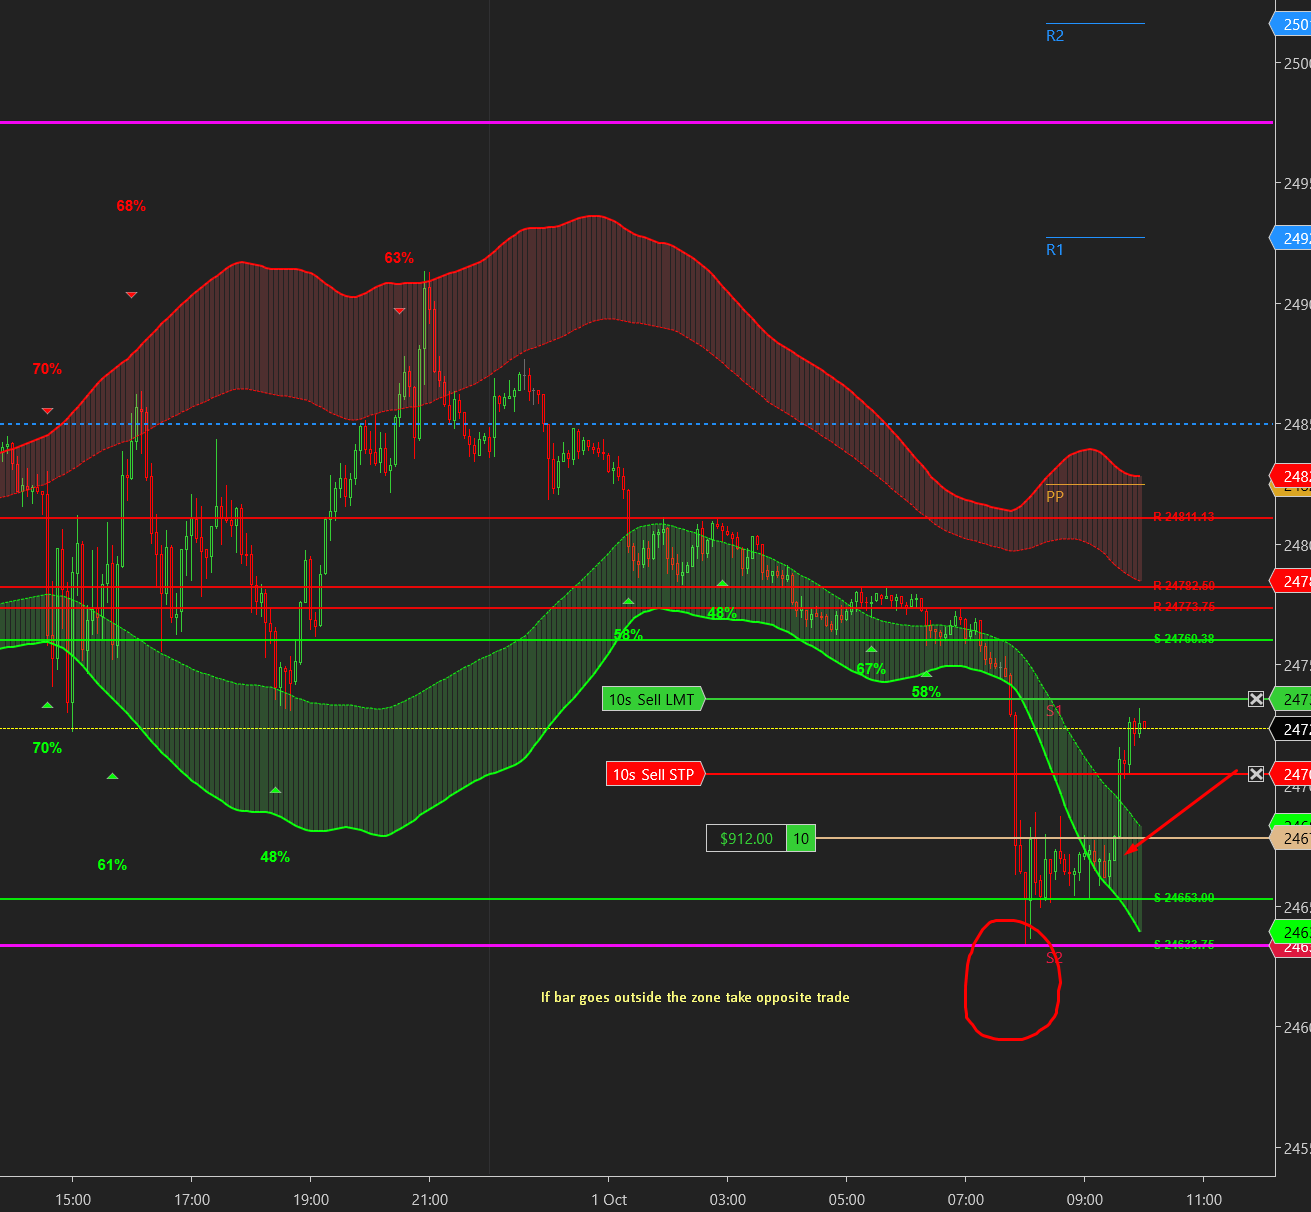
UltraADXVolatilityWaves
Professional ADX-powered volatility zones indicator with dynamic Support/Resistance, Daily/Weekly levels, ATR-based TP/SL targets, and probability-scored signals. Identify potential reversal zones in real-time.
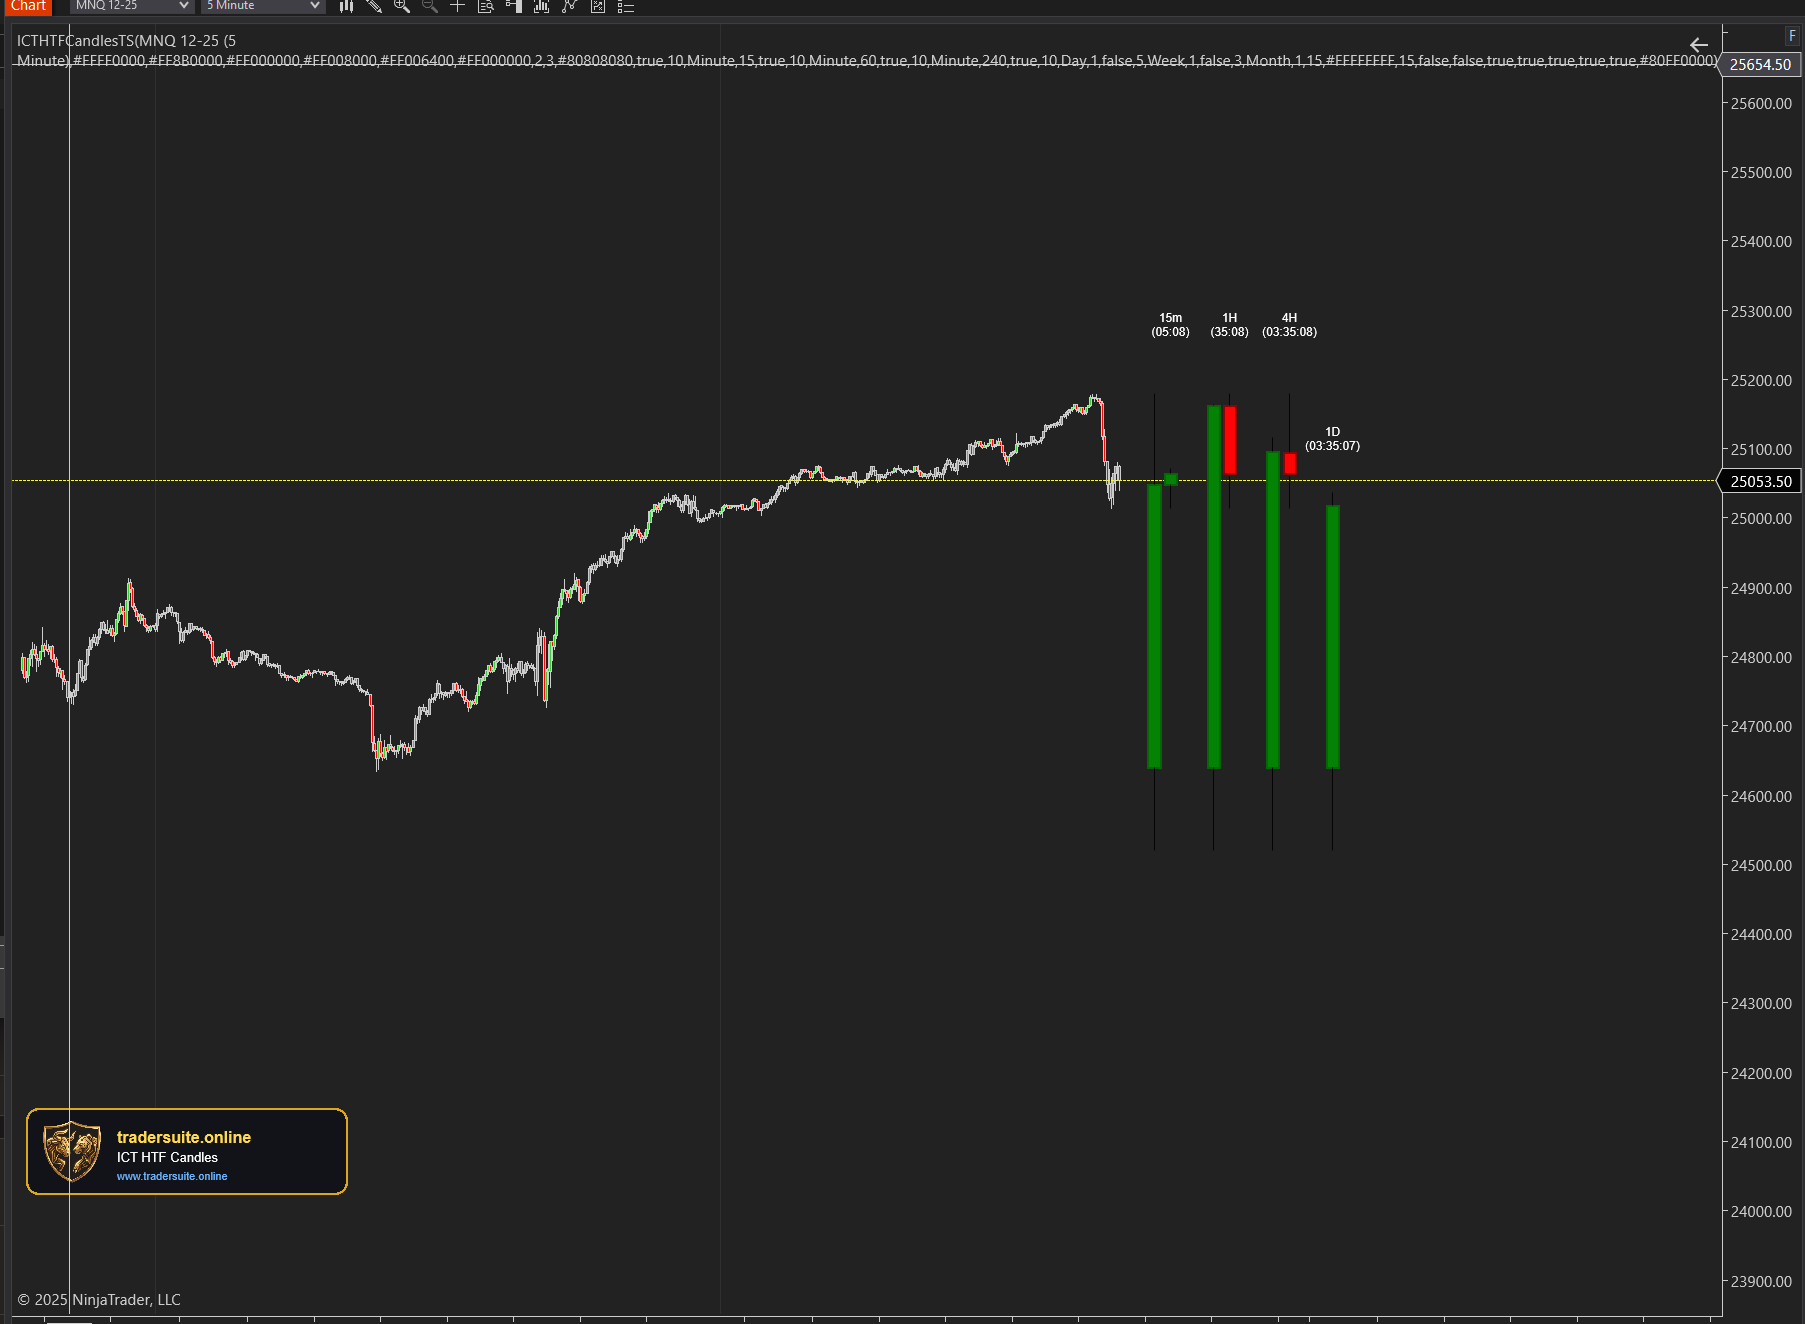
ICT HTF Candles Pro
Visualize multiple higher timeframe candles directly on your chart with real-time countdown timers, Fair Value Gap detection, and Volume Imbalance highlighting. Perfect for ICT traders who need multi-timeframe confluence without switching charts.