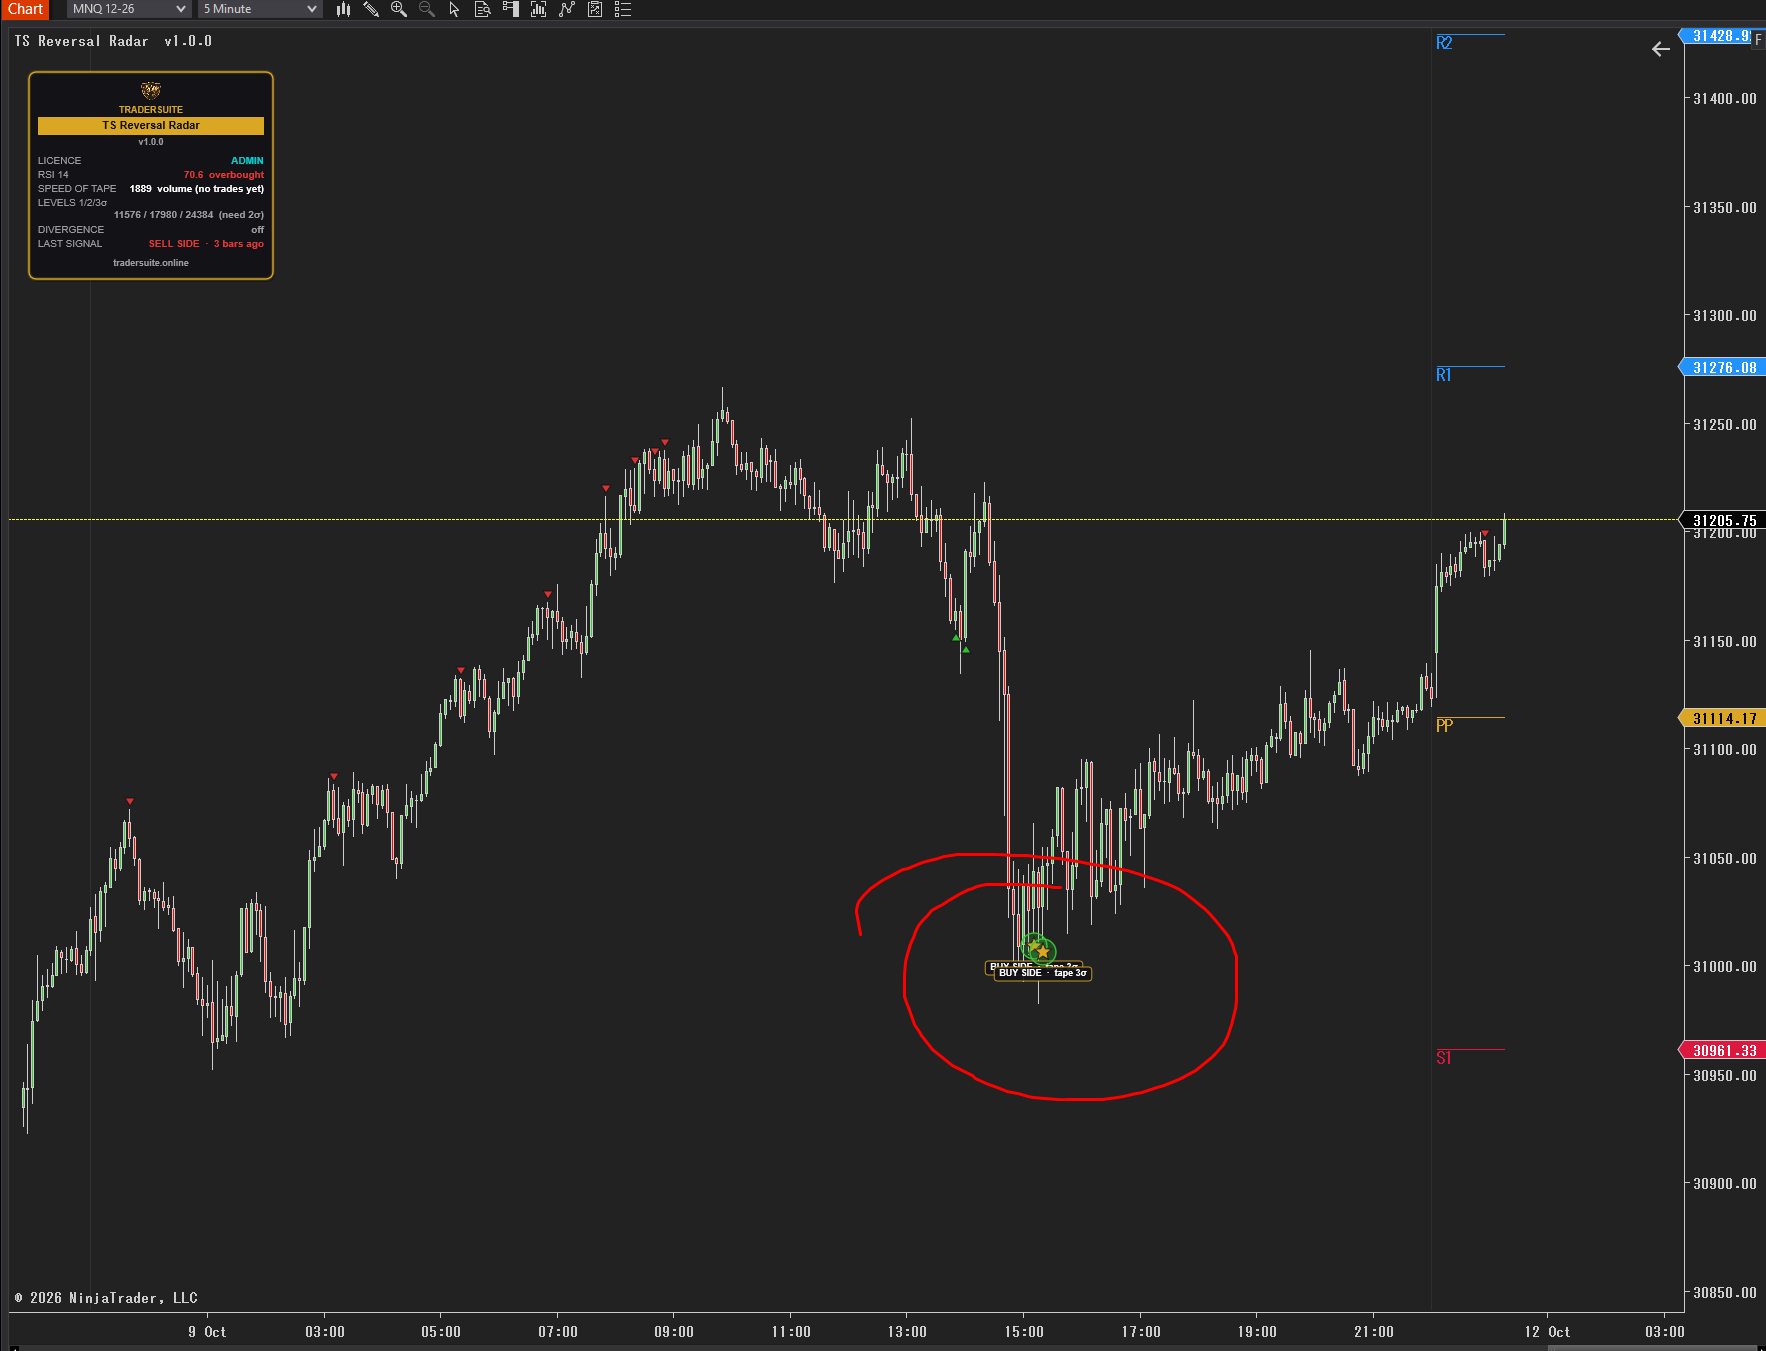
TS Reversal Radar
Overbought / oversold signals from six gauges, upgraded to gold Radar Stars when the speed of the tape spikes – plus magenta exhaustion candles. Closed candles only, never repaints.
Secure download
Instant access
Lifetime updates
Free forever
2 activations
Per licence
Documentation
Download user guide
TS Reversal Radar marks the moments a move has stretched too far – and highlights the ones where the market was trading unusually fast.
It works in three layers, all on the price chart:
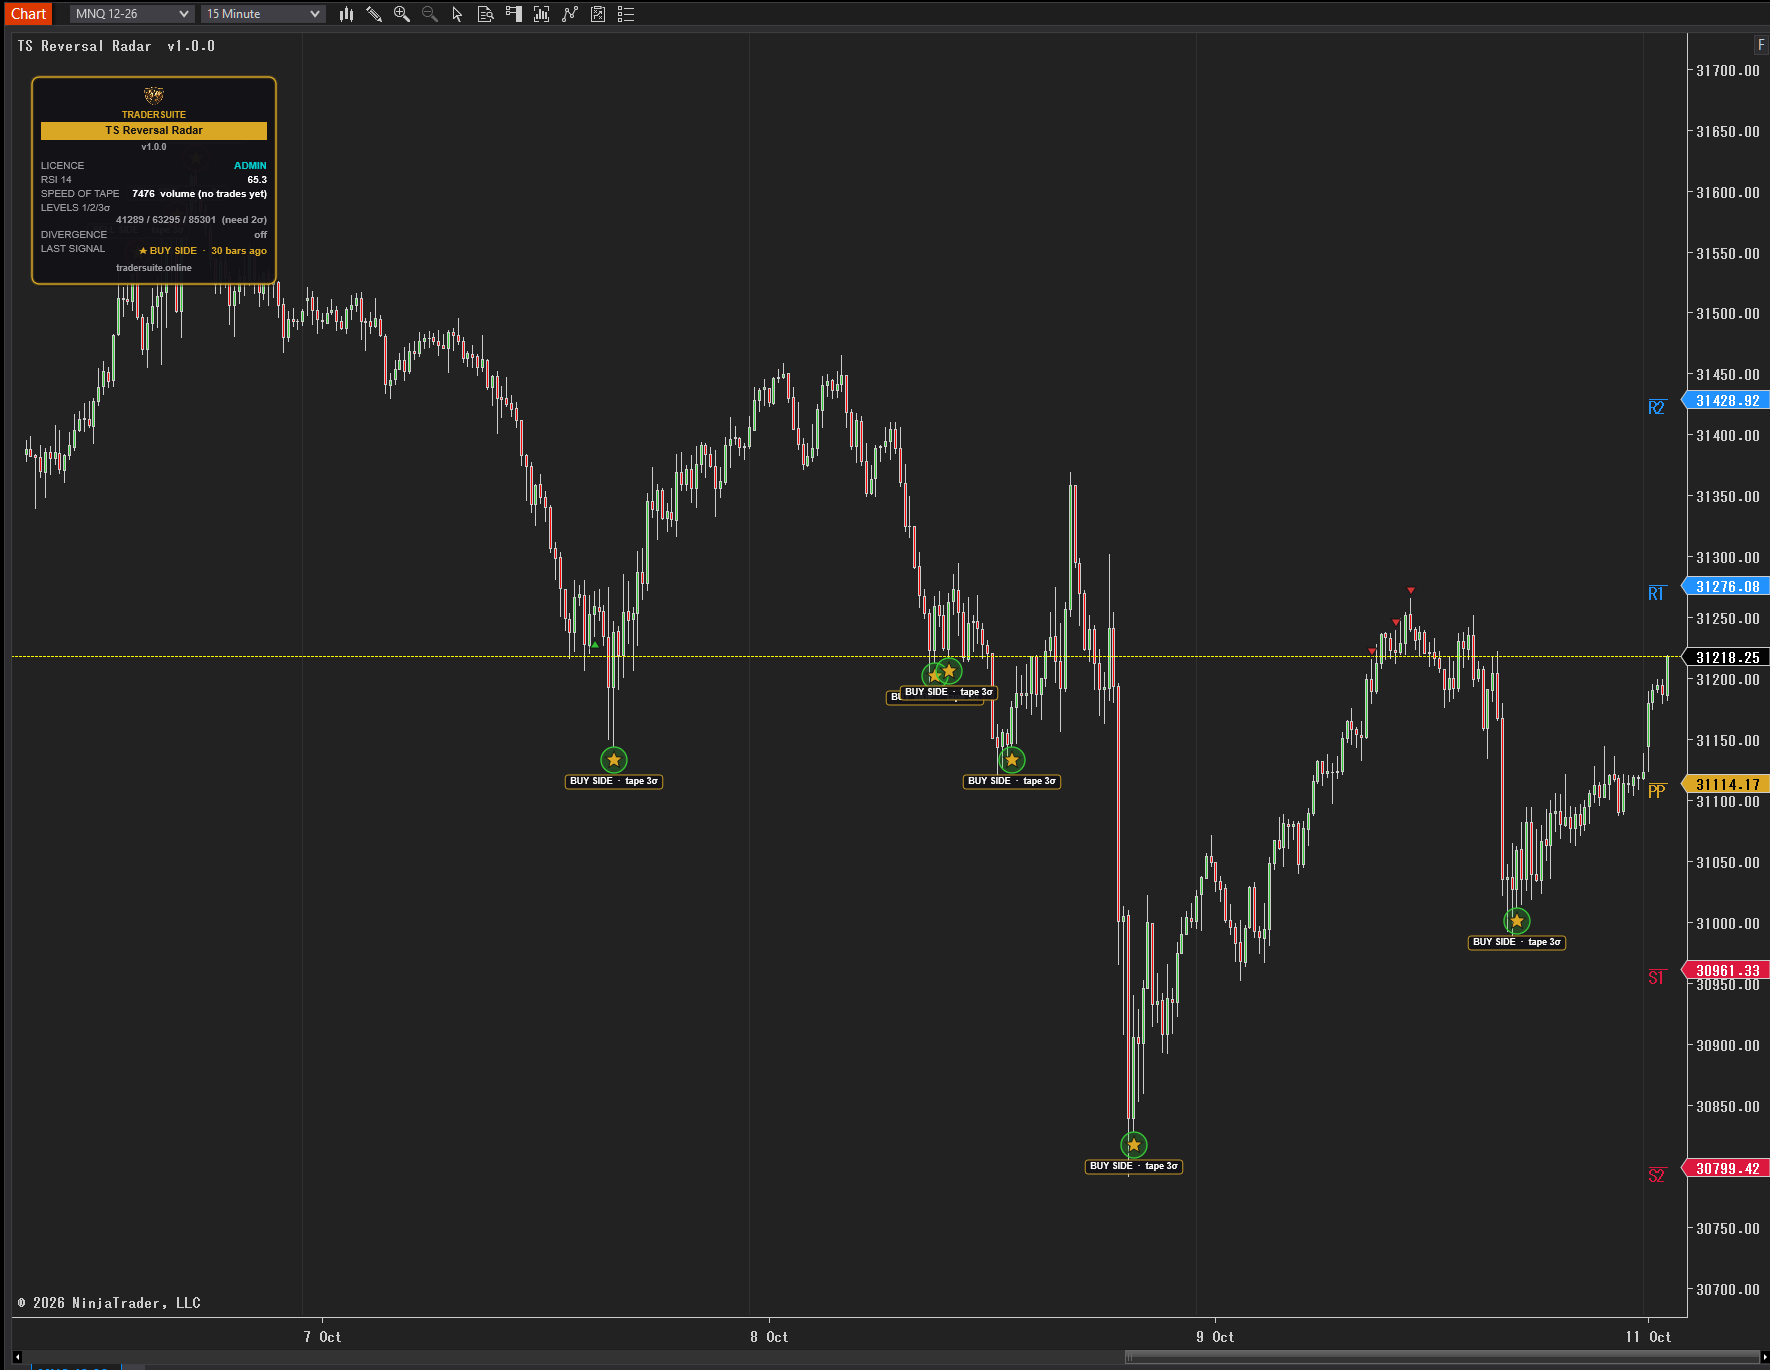
- Overbought / oversold signals – pick your gauge: RSI, CCI, Williams %R, Stochastics, or price outside the Bollinger or Keltner bands. A red arrow marks the candle where the gauge leaves overbought (sell side); a green arrow where it leaves oversold (buy side). Or show a dot on every candle inside the zone.
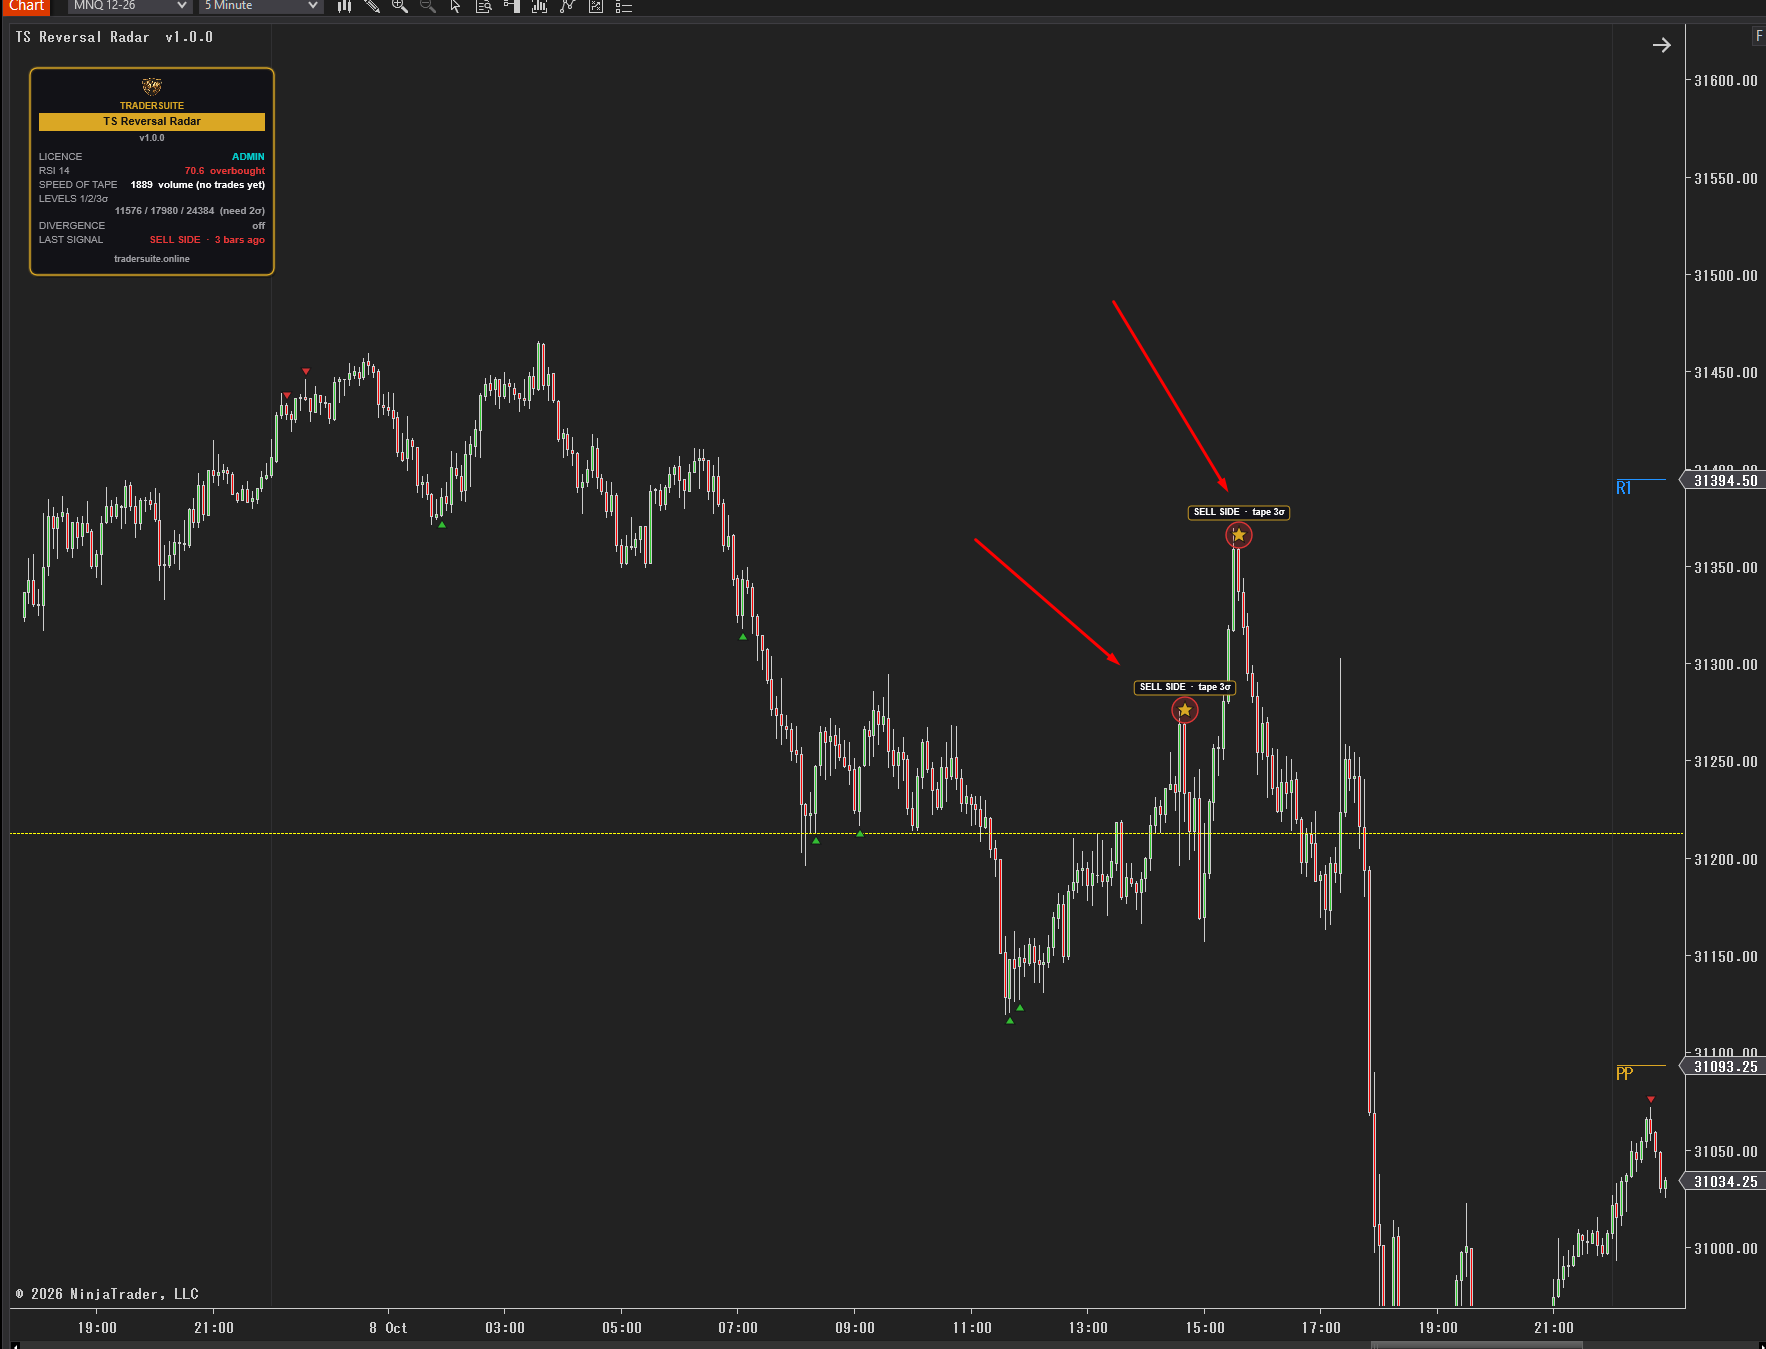
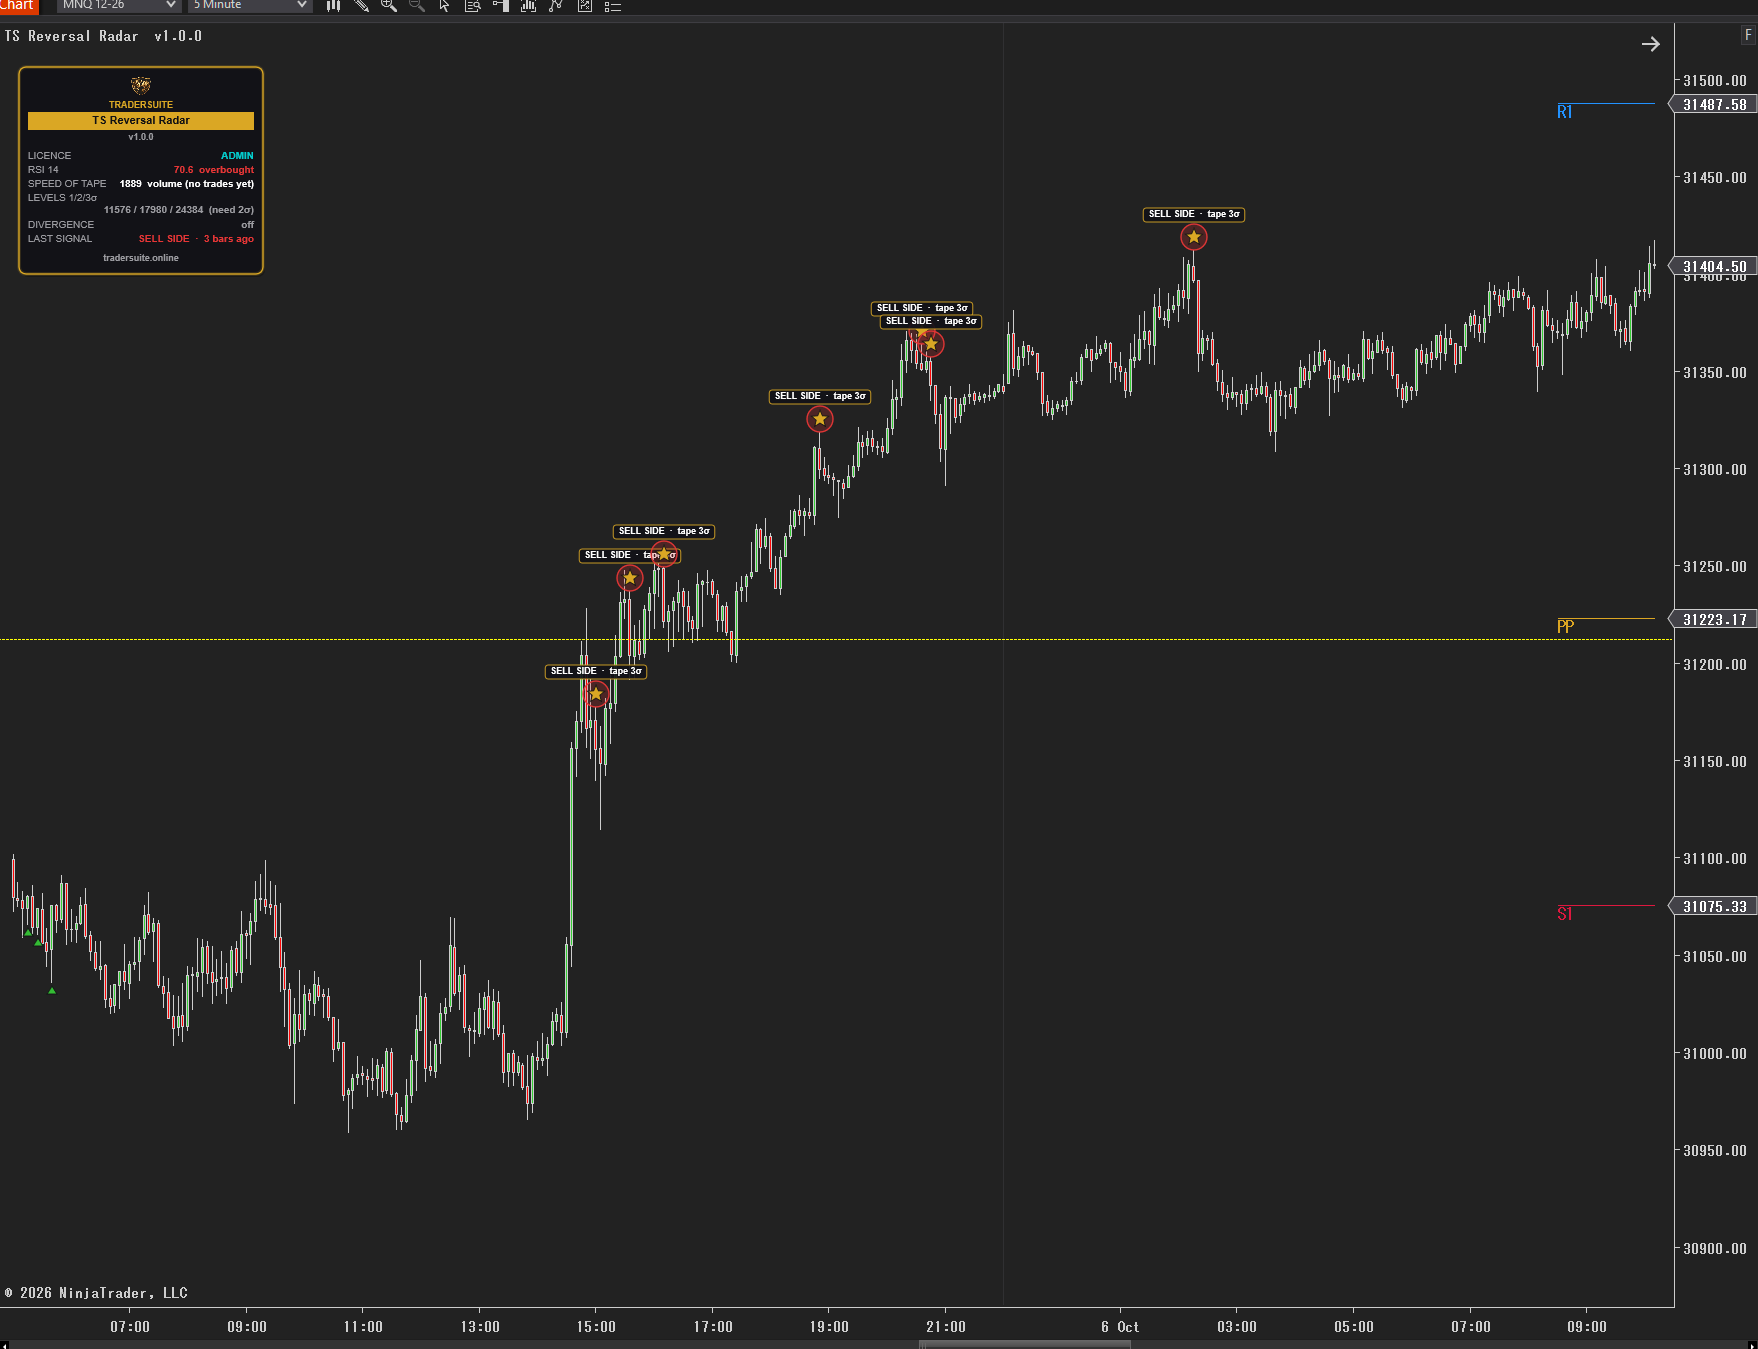
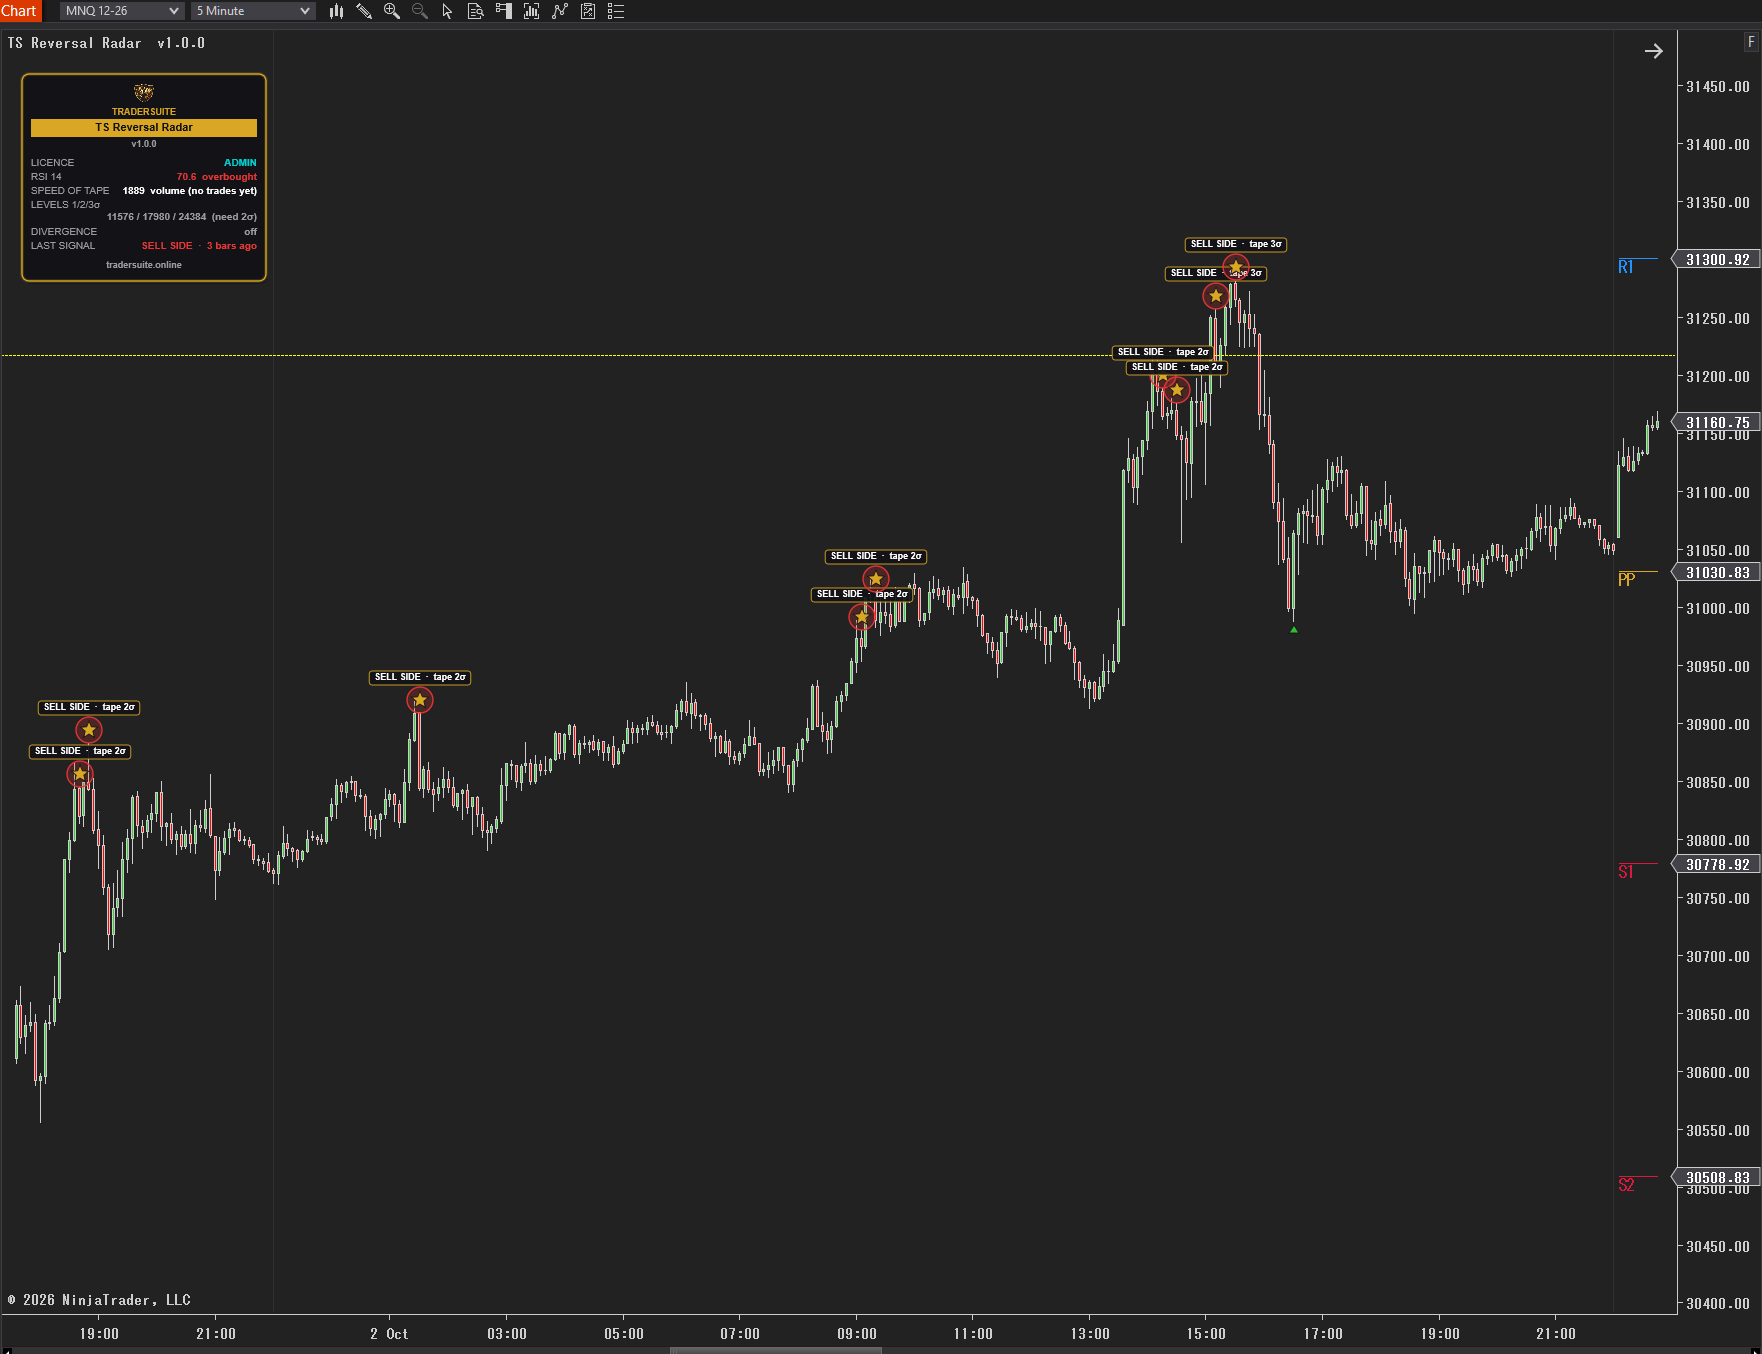
- Radar Stars – the same signal, upgraded to a gold star when the speed of the tape (the most trades in any 5-second window) reached 1, 2 or 3 standard deviations above normal during the move. Each star is tagged with the reason, e.g. "SELL SIDE · tape 2σ". Optionally require – or rule out – a divergence on ROC, Stochastics, RSI, CCI, MACD, Momentum or the Ultimate Oscillator.
- Magenta exhaustion candles – a new 20-candle high or low with RSI 14 at an extreme on below-average volume. The push may be running out of steam.
Everything is worked out on closed candles, so nothing repaints. A compact panel shows the gauge, the tape against its levels, the divergence rule and the last signal. Alerts fire on Radar Stars.
Overbought is a description, not a forecast. TS Reversal Radar is a context and alert tool – it does not place trades and is not financial advice.
Product Demo
Related products
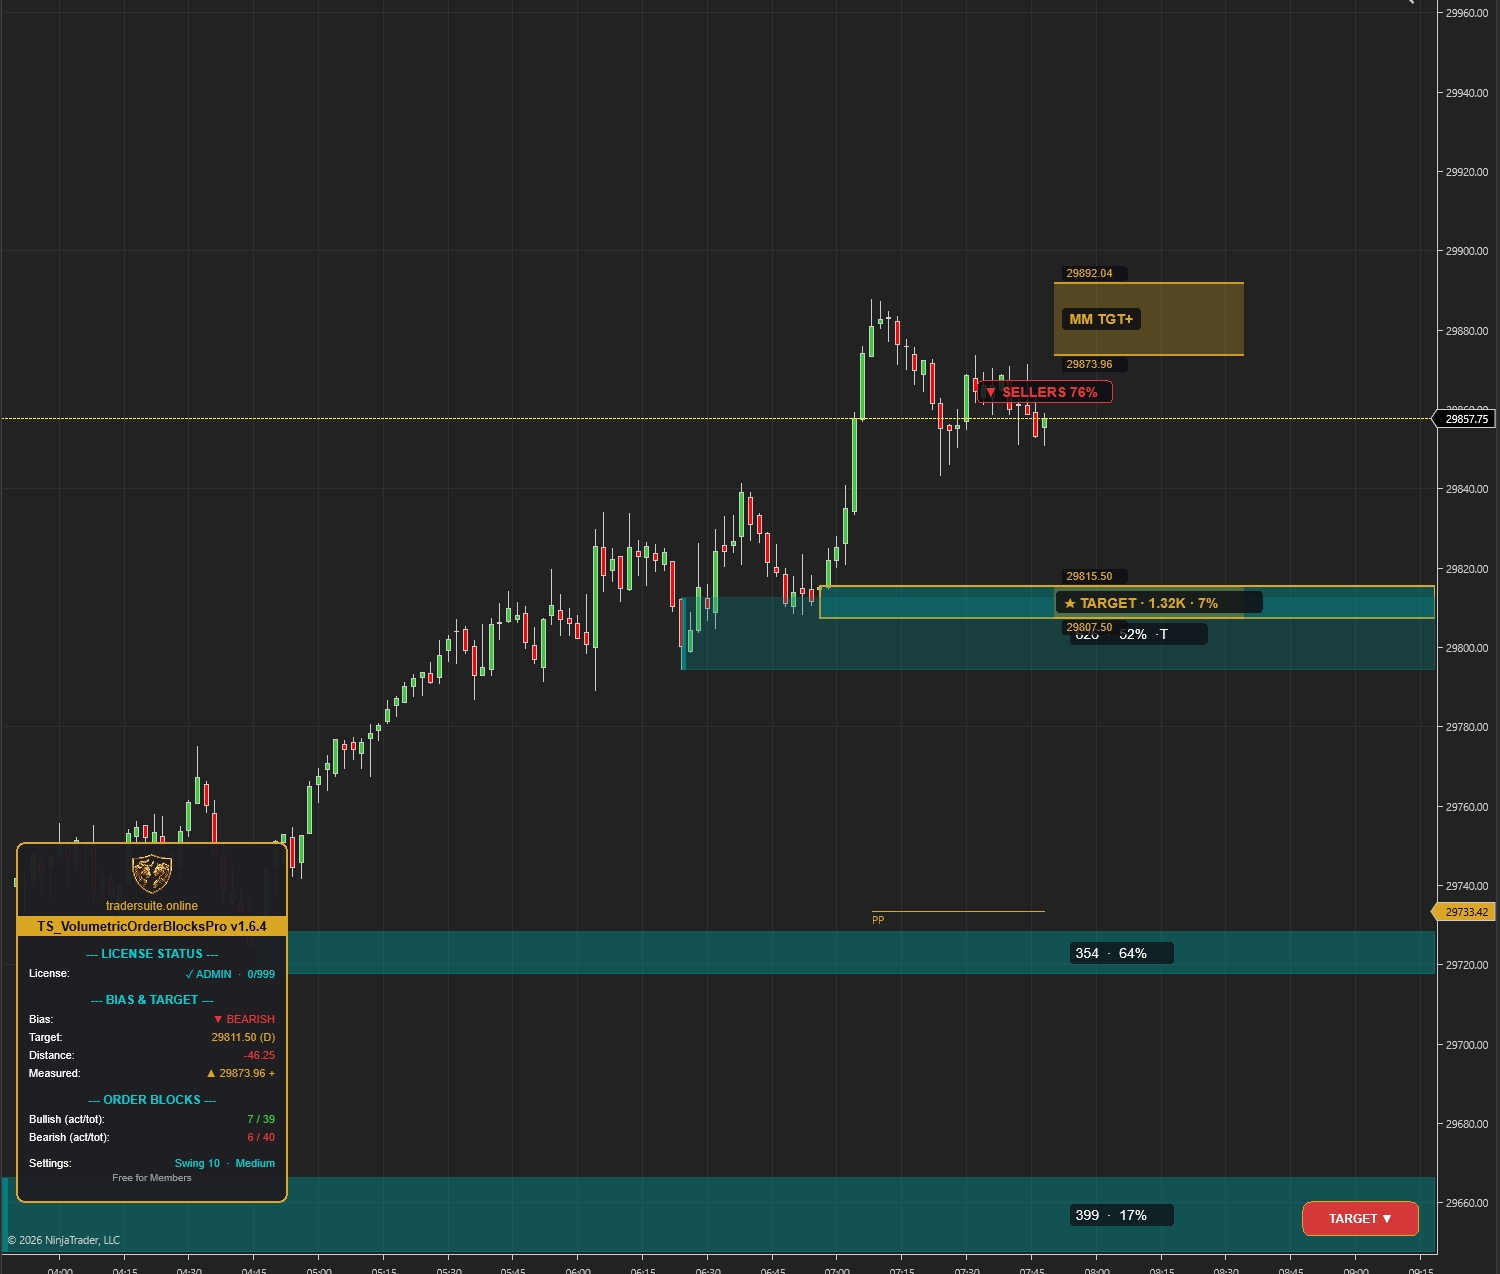
Volumetric Order Blocks Pro
Automatically detect institutional supply & demand zones with volume-weighted order blocks. Identify potential reversal zones where smart money is positioned.
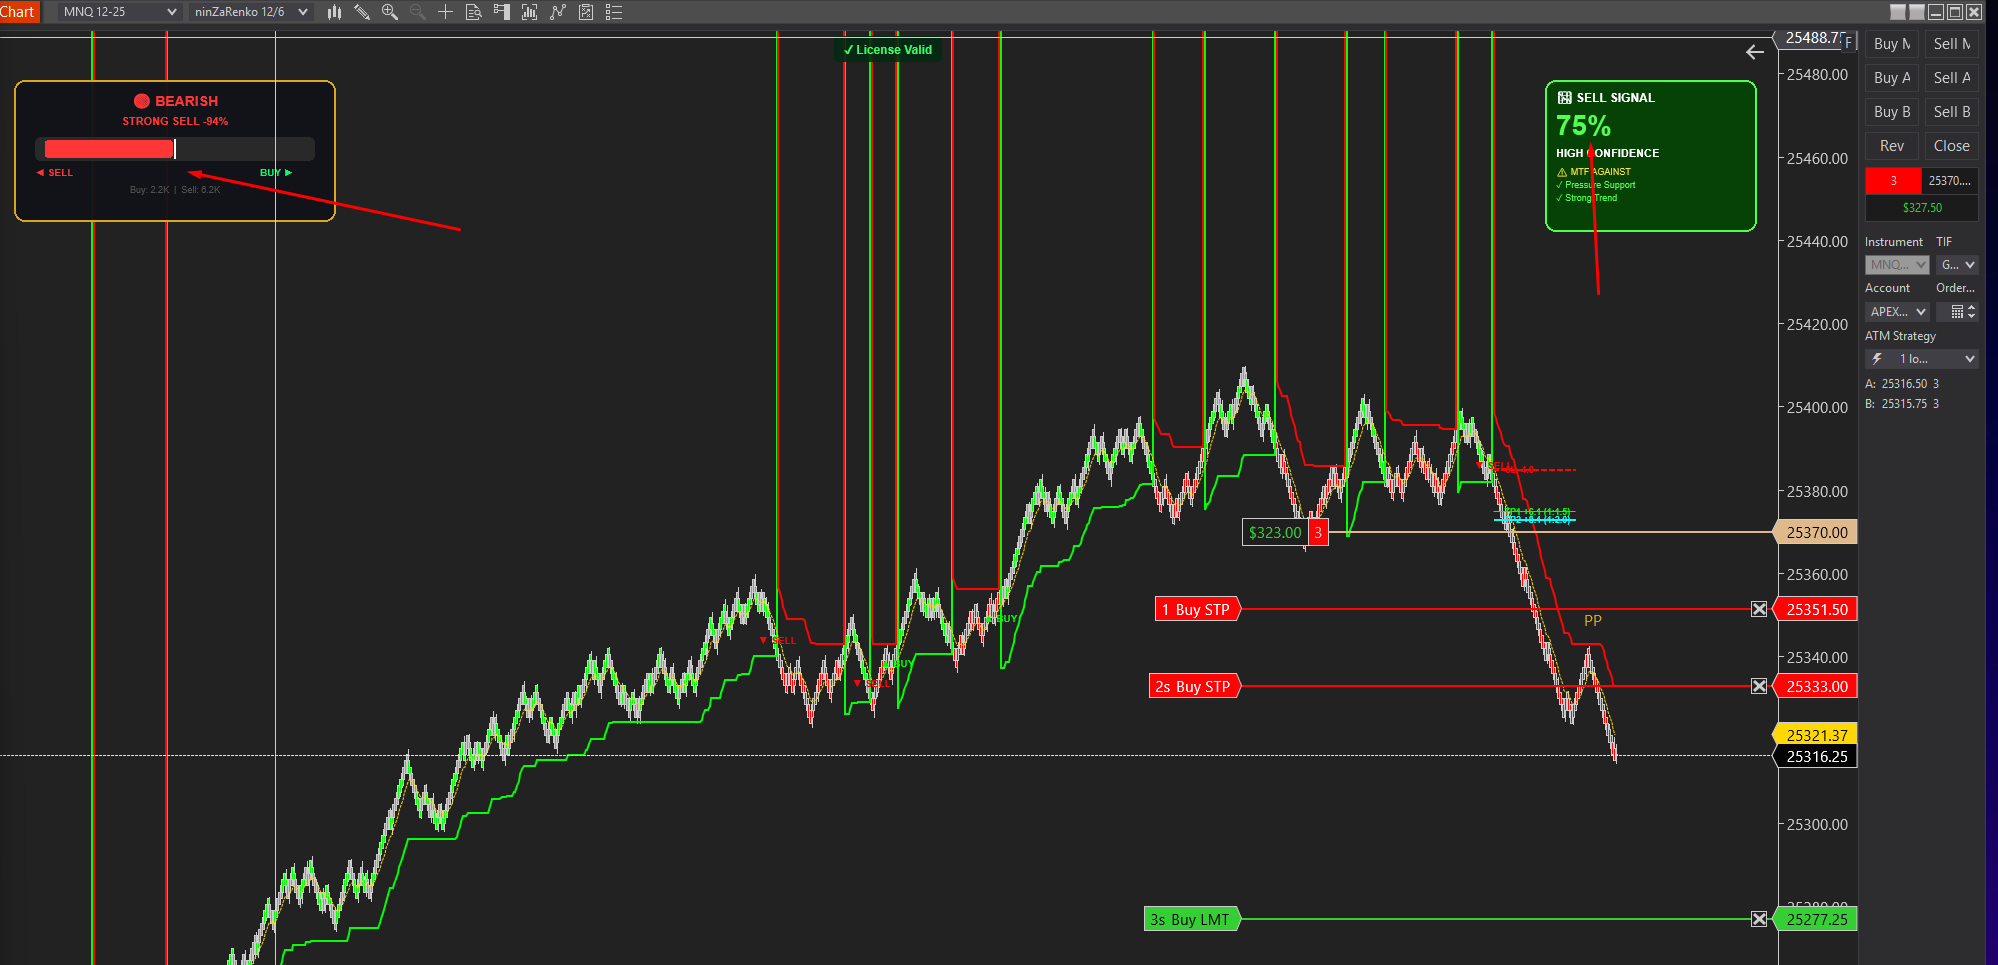
Smartflowpro
Advanced order flow analysis with real-time Pressure Delta Meter, multi-timeframe confluence scoring, and intelligent signal probability rating. Know who's in control before you trade.
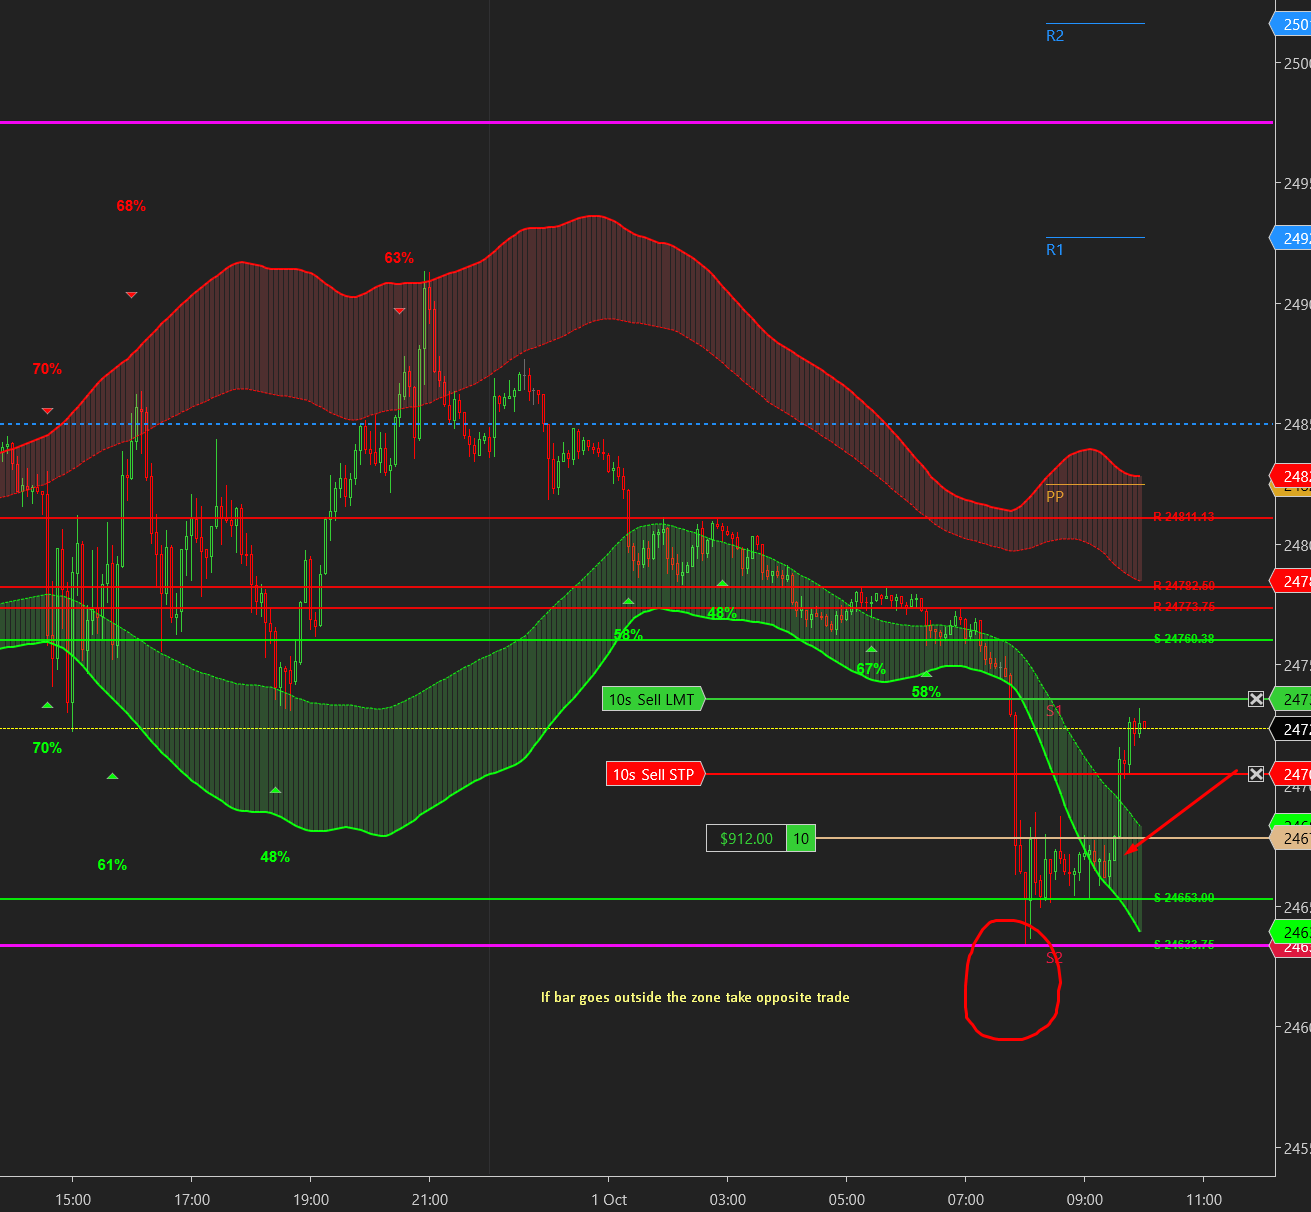
UltraADXVolatilityWaves
Professional ADX-powered volatility zones indicator with dynamic Support/Resistance, Daily/Weekly levels, ATR-based TP/SL targets, and probability-scored signals. Identify potential reversal zones in real-time.
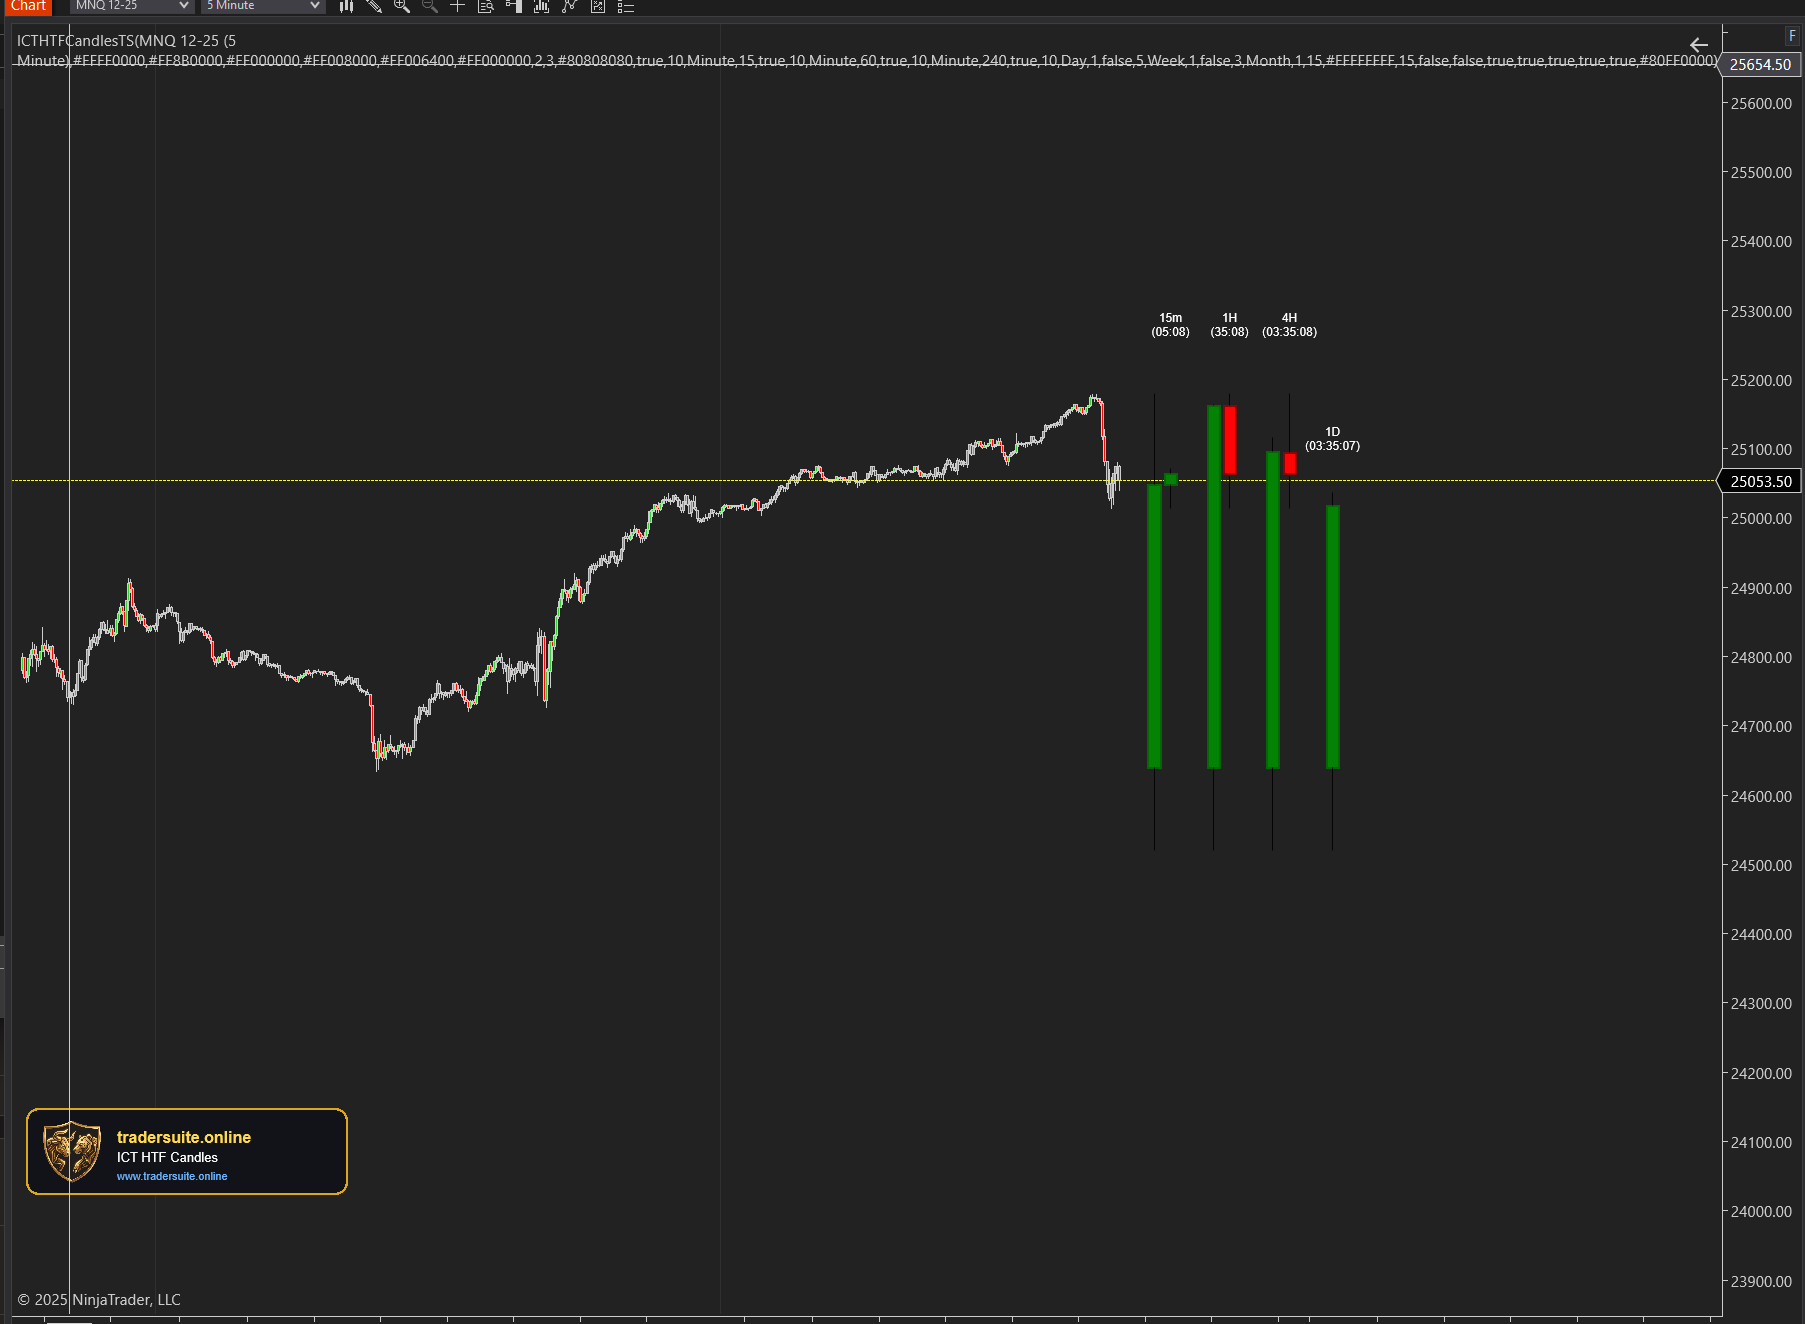
ICT HTF Candles Pro
Visualize multiple higher timeframe candles directly on your chart with real-time countdown timers, Fair Value Gap detection, and Volume Imbalance highlighting. Perfect for ICT traders who need multi-timeframe confluence without switching charts.