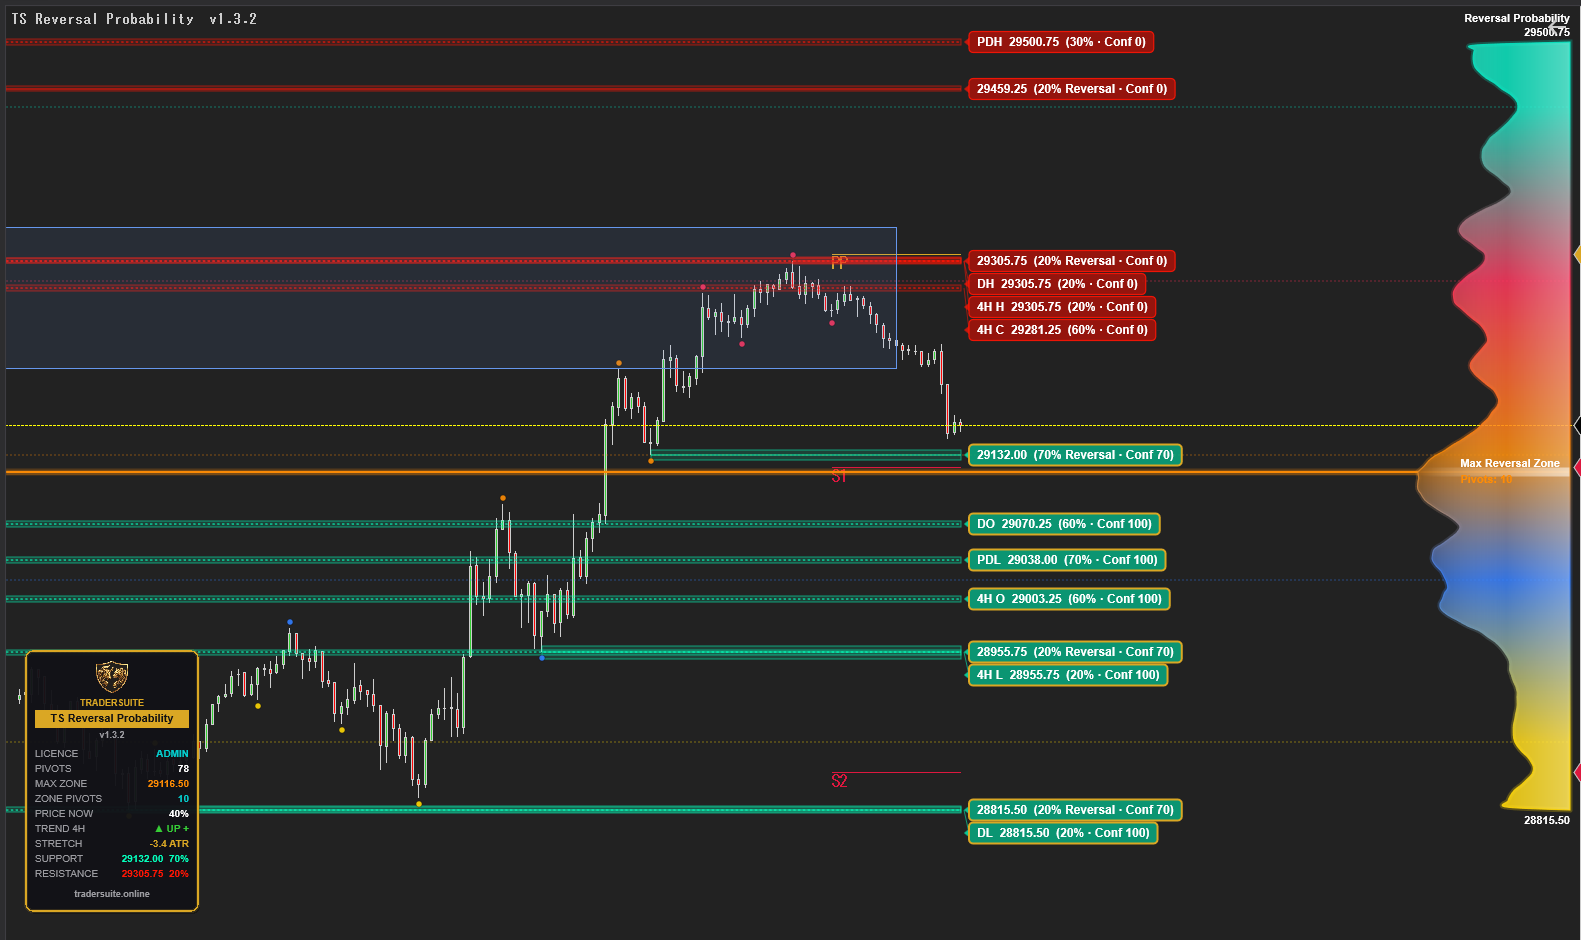
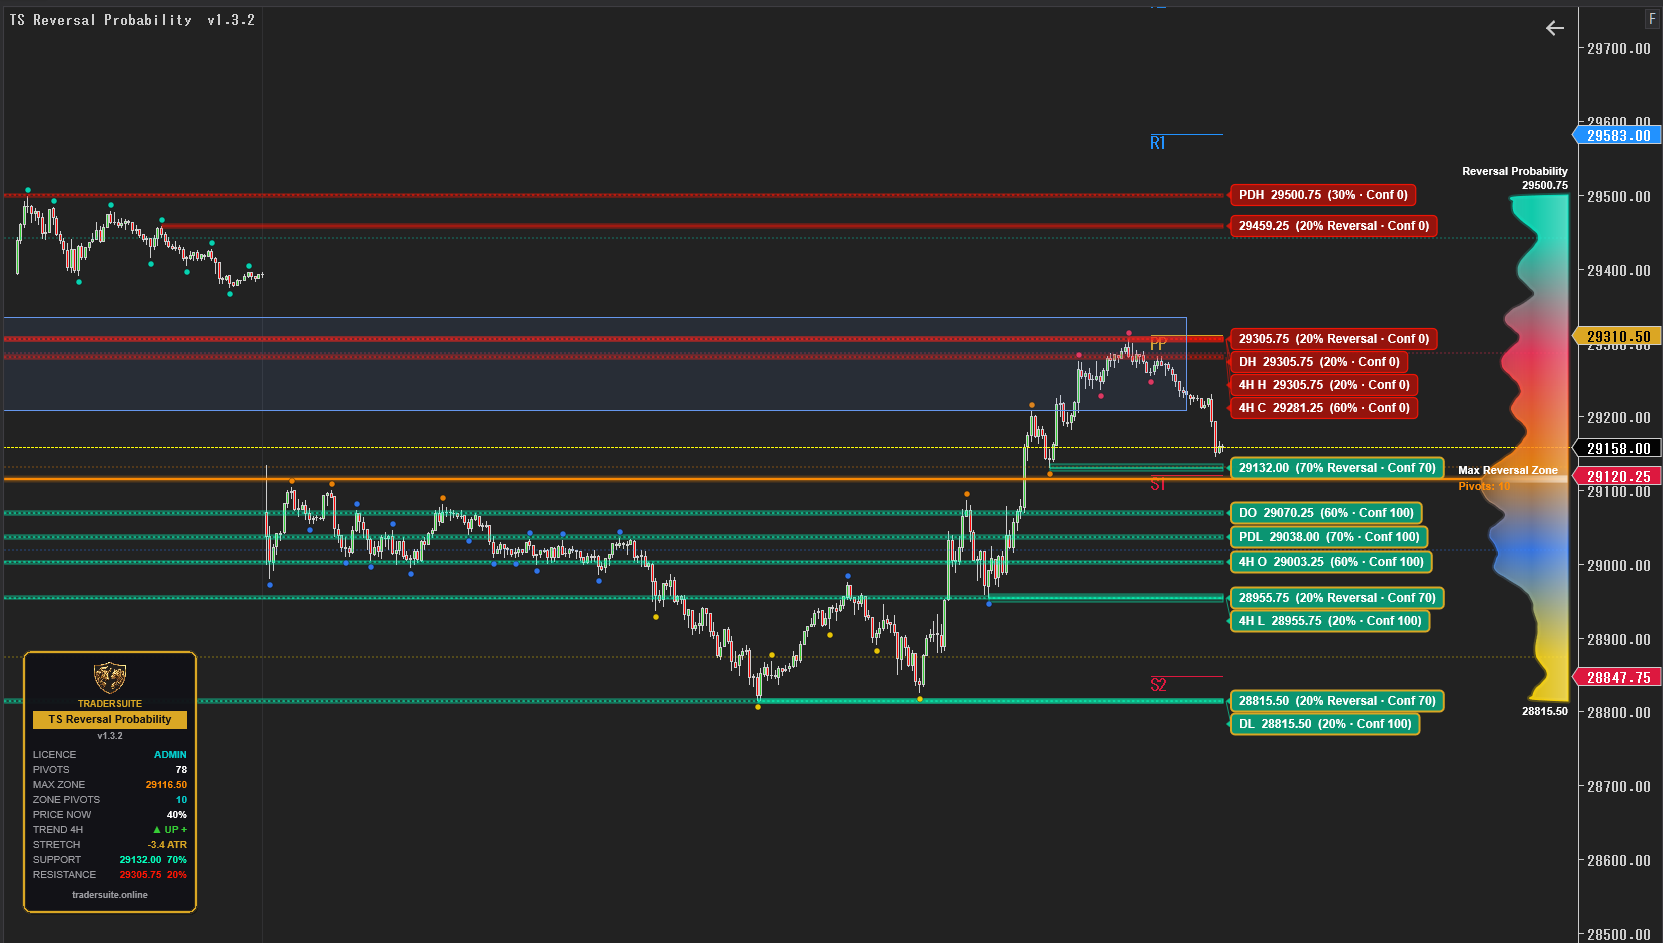
TS Reversal Probability Levels
Builds a live profile of where price has actually reversed. Pivot highs and lows feed a density profile in the right margin, and every support and resistance level is tagged with its reversal probability.
Secure download
Instant access
Lifetime updates
Free forever
2 activations
Per licence
Documentation
Step-by-step guides
Most support and resistance tools draw a line and leave you to guess how much it matters. TS Reversal Probability answers that question with the chart's own history: it finds every confirmed pivot high and low over your lookback window, stacks them into price bins, and shows you where price has turned most often.
The result is a flowing liquid profile down the right-hand margin. The widest part is the max reversal zone — the price area with the heaviest history of turns. That zone becomes the 100% reference, and every other level on the chart is labelled as a percentage of it. A level tagged 82% has seen nearly as much reversal activity as the busiest price on the chart. A level at 20% has seen very little.
Pivot prices are grouped into colour clusters, so you can see at a glance which levels belong to the same shelf of activity rather than reading a wall of identical lines. Active levels carry a pill tag with the price and its probability; once a level breaks, it fades to a faint dotted line so you keep the history without the clutter.
Beyond raw density
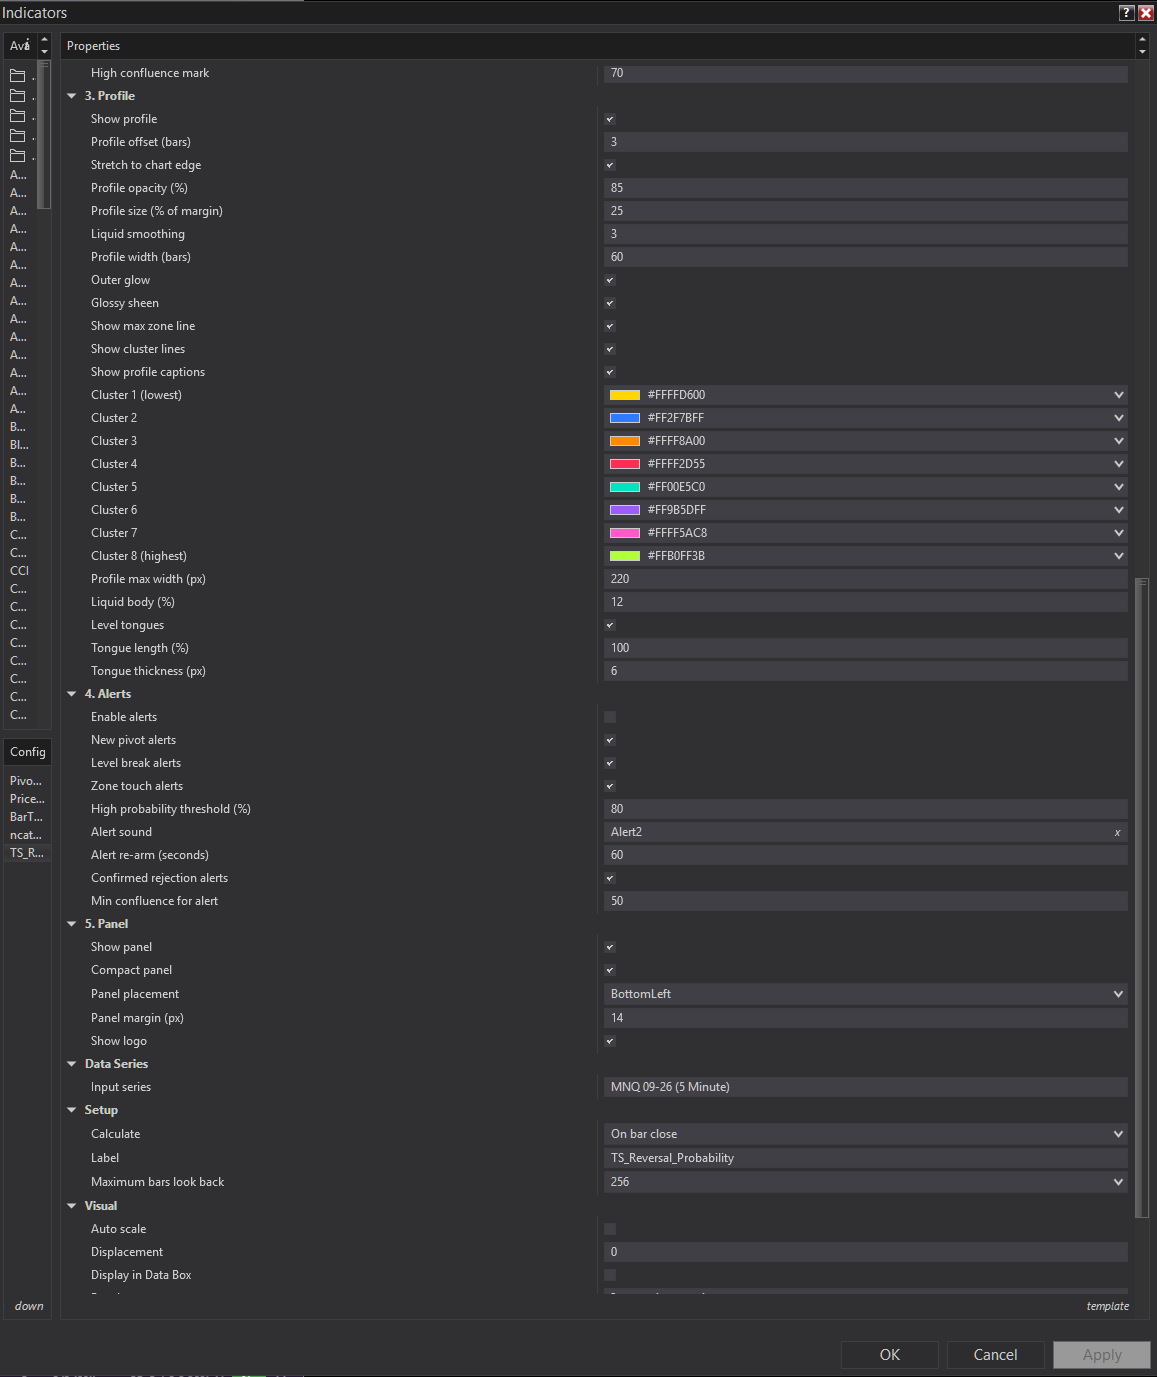
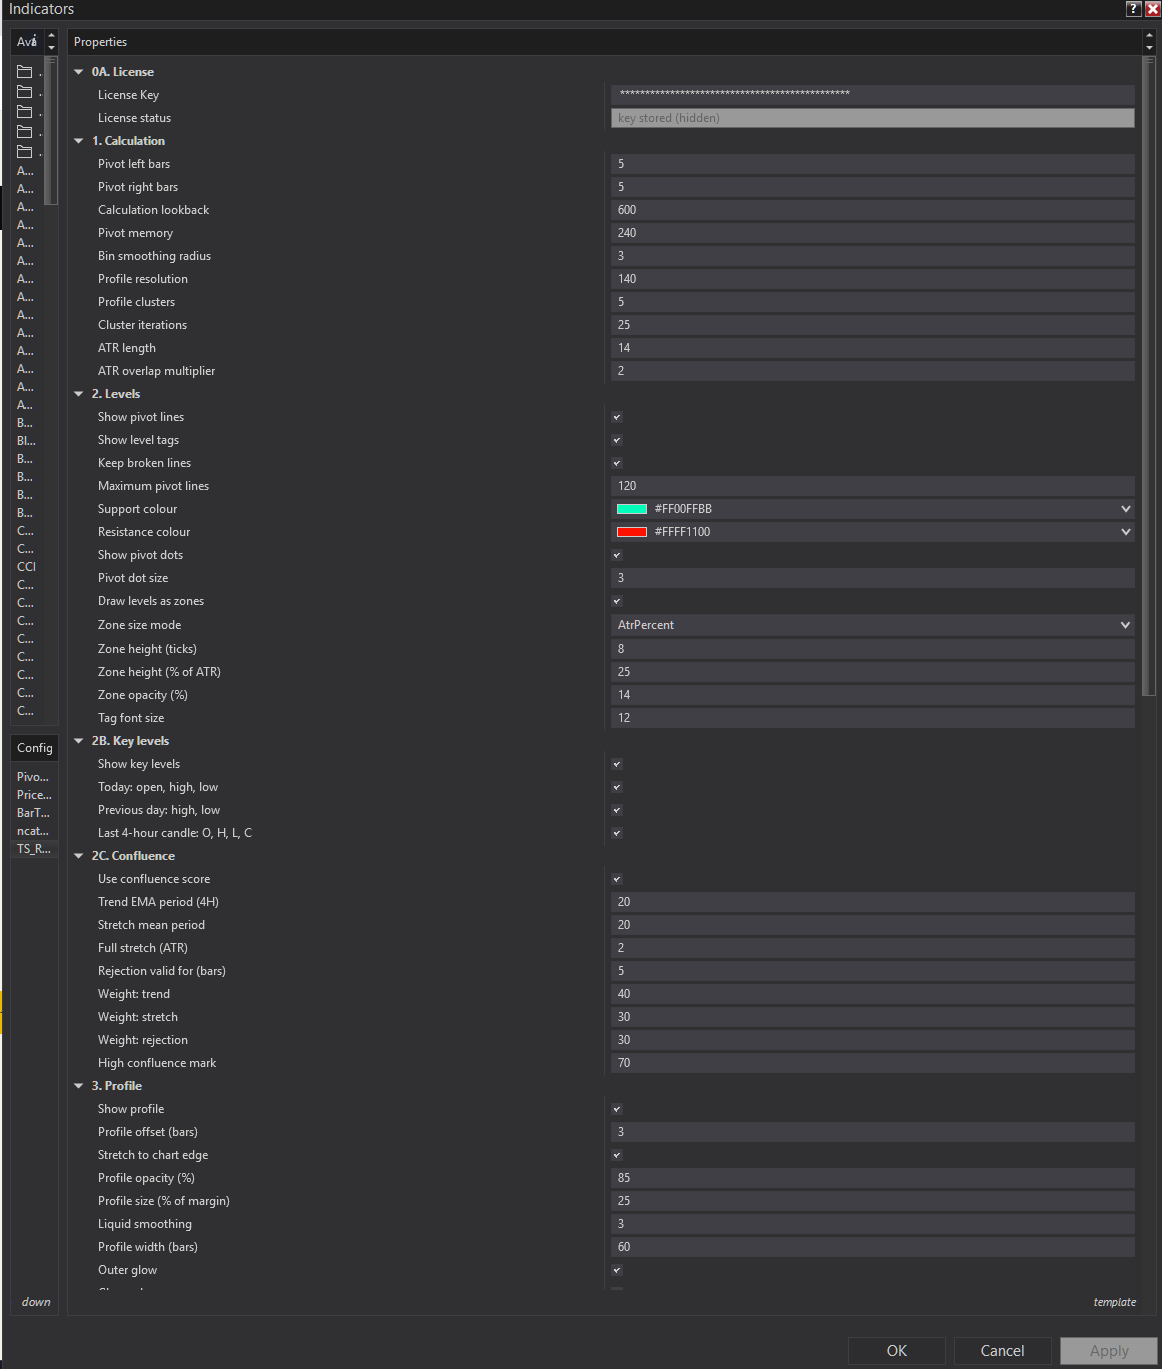
A busy level alone is not a trade. The optional confluence score weighs three things at the moment price arrives at a level: the 4-hour trend, how stretched price is from its mean in ATR terms, and whether a rejection has actually printed. You set the weight of each. Levels that score highly get marked, and alerts can be filtered so you only hear about the ones that clear your threshold.
Built to be read, not decoded
An on-chart panel keeps the numbers in one place: pivots in the window, the max zone and how many pivots formed it, where price is sitting now, the 4-hour trend, current stretch, and the nearest support and resistance with their probabilities. Compact or full, in any corner.
The probability figure is the relative density of past turning points — a transparent, readable measure of where this market has reversed before. It is a study tool, not a forecast, and not trading advice.
Related products
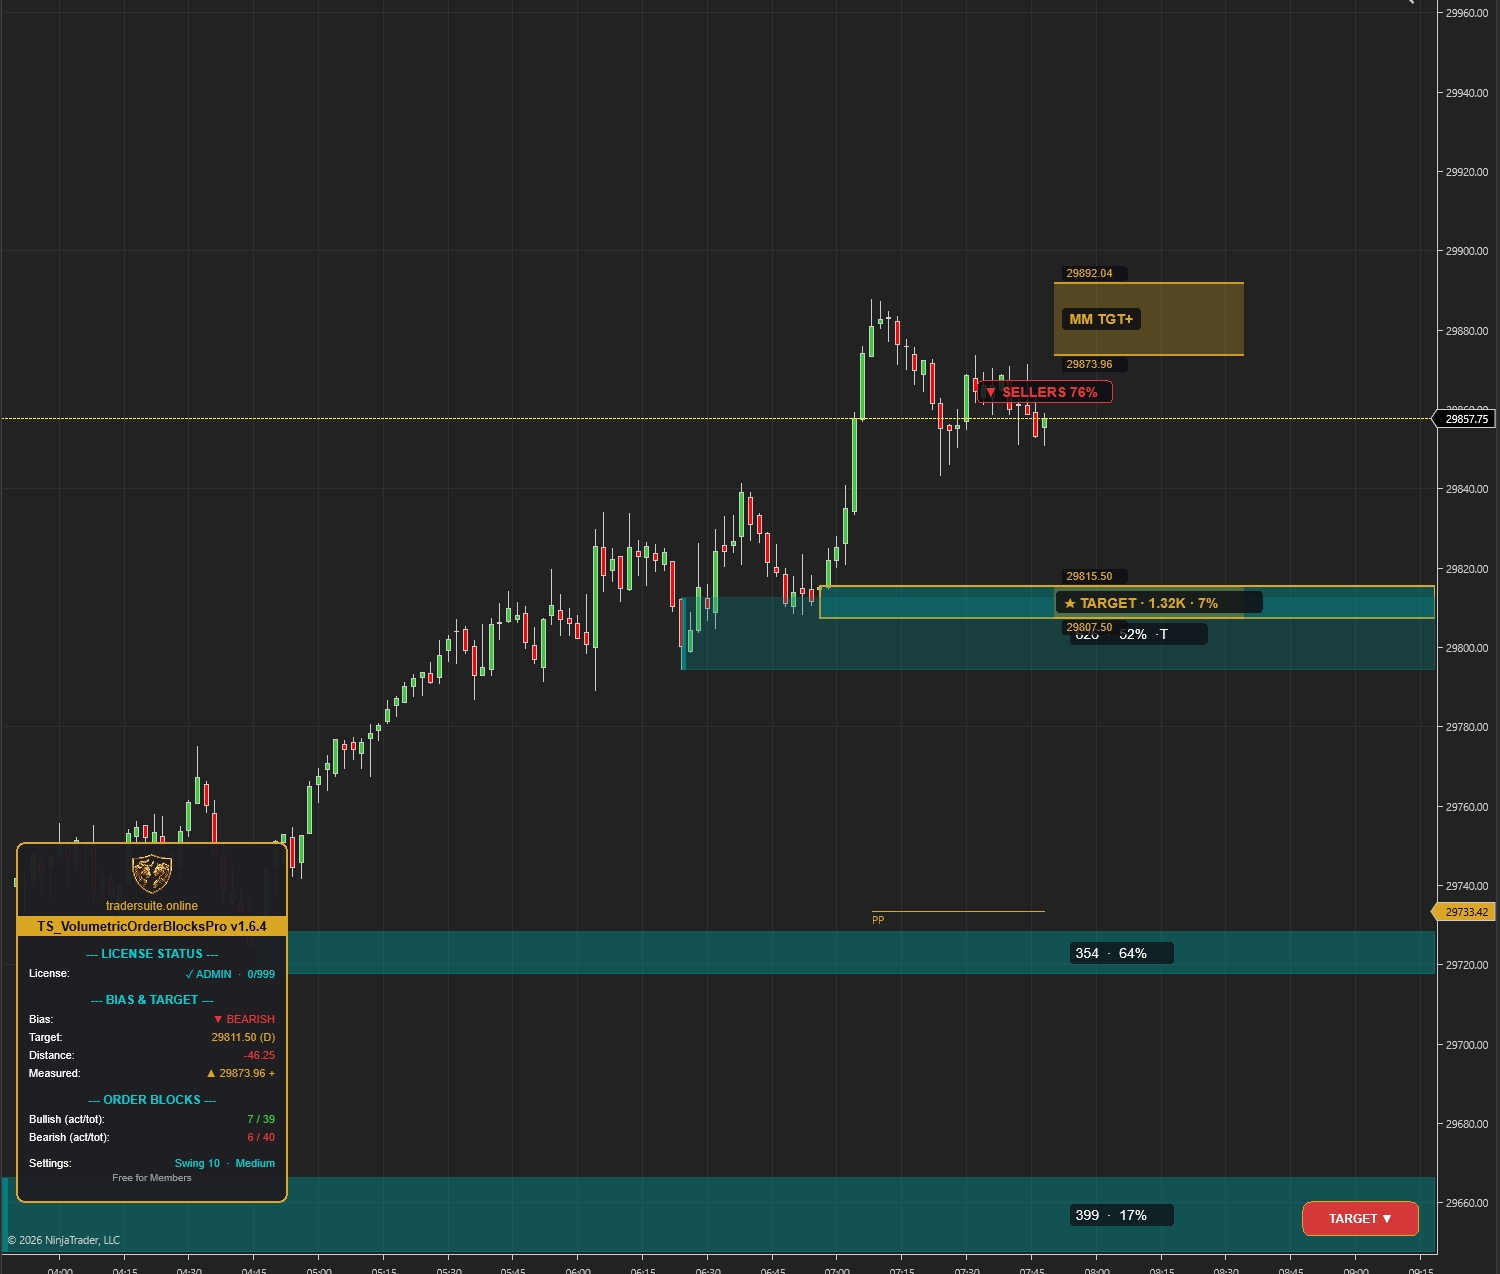
Volumetric Order Blocks Pro
Automatically detect institutional supply & demand zones with volume-weighted order blocks. Identify potential reversal zones where smart money is positioned.
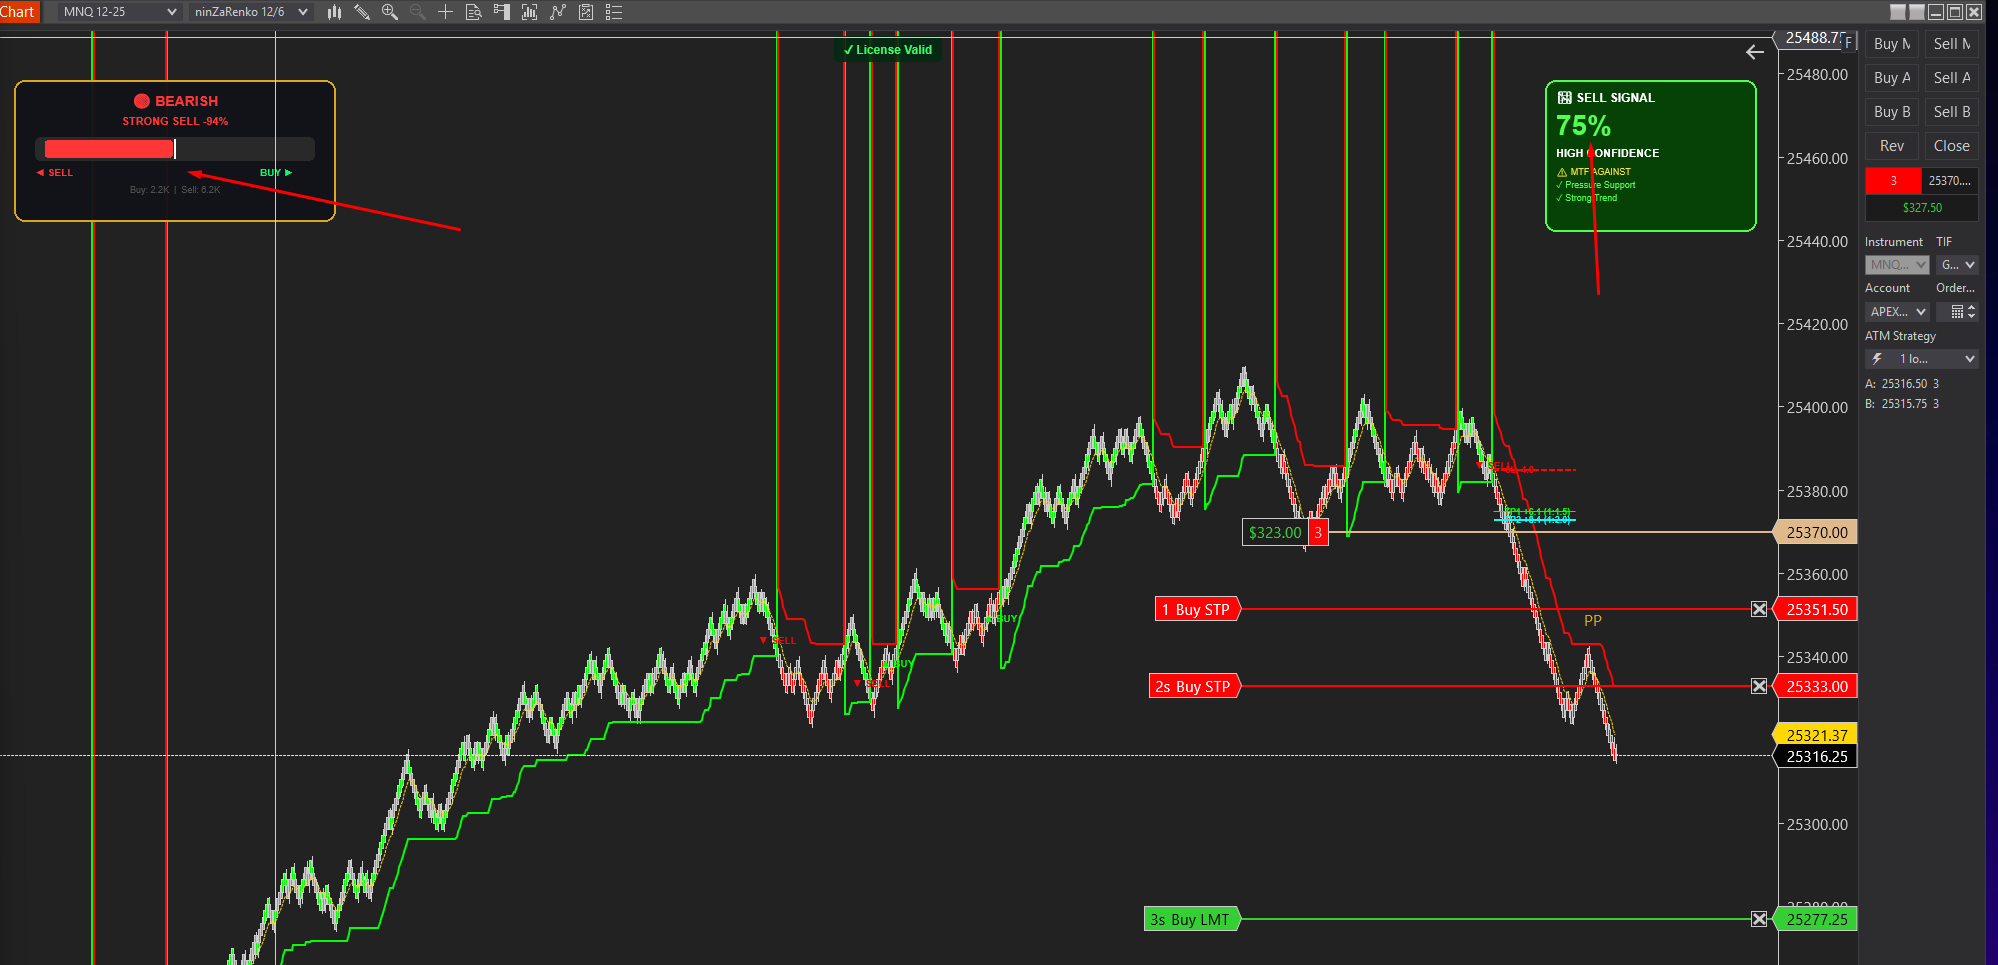
Smartflowpro
Advanced order flow analysis with real-time Pressure Delta Meter, multi-timeframe confluence scoring, and intelligent signal probability rating. Know who's in control before you trade.
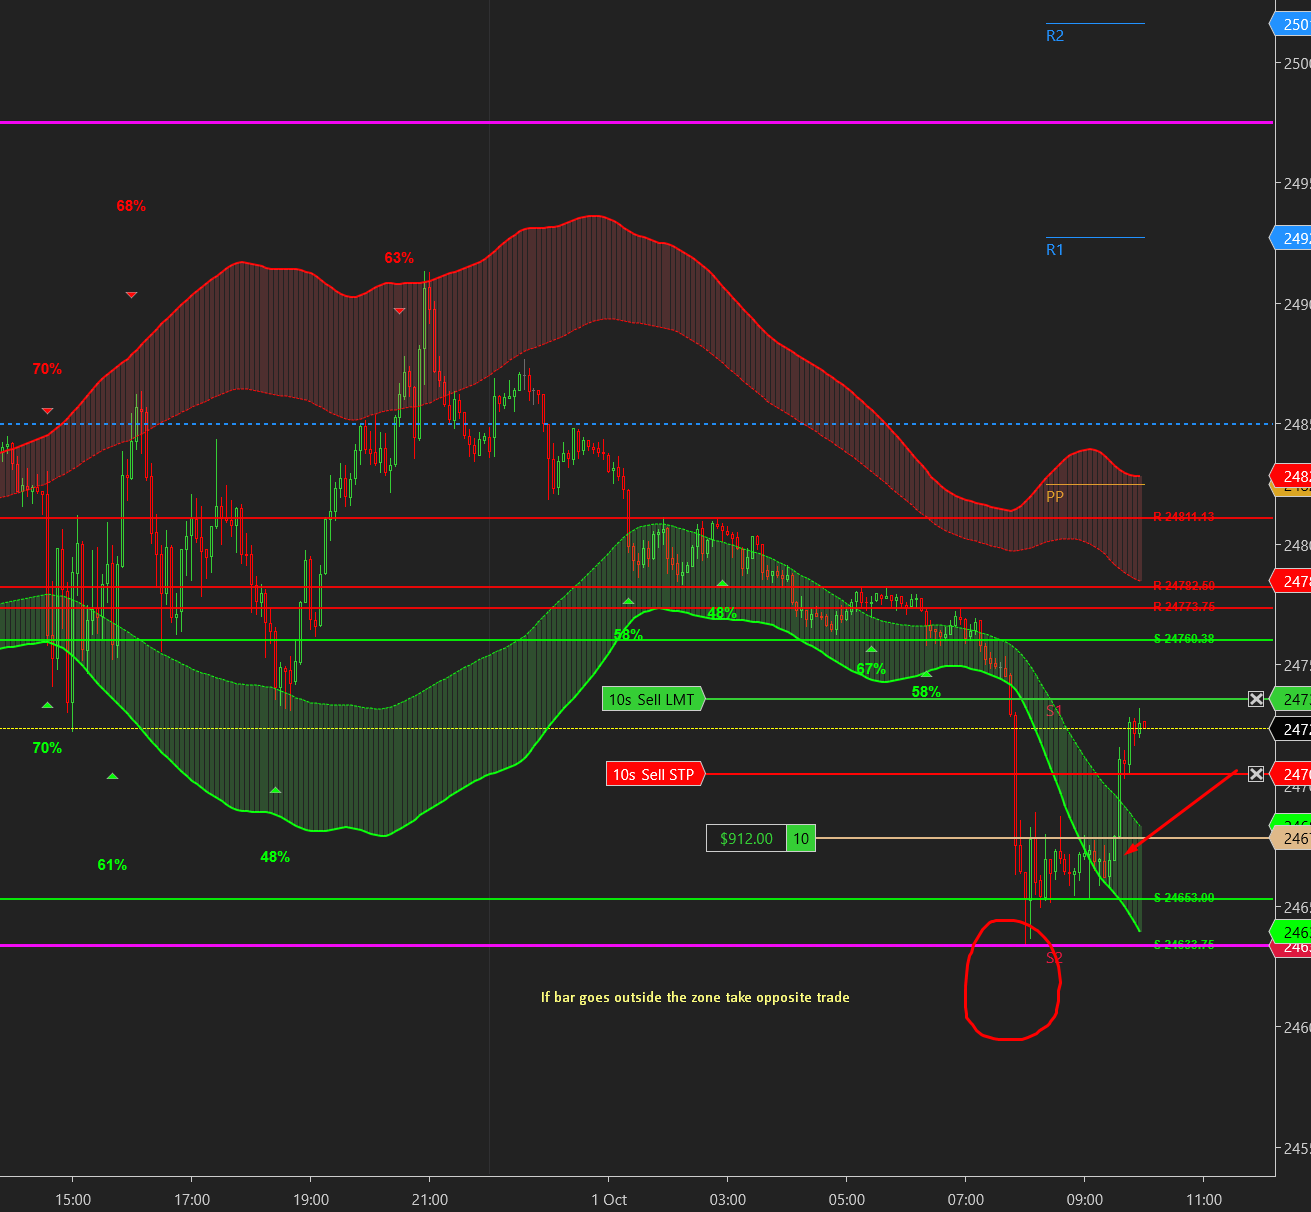
UltraADXVolatilityWaves
Professional ADX-powered volatility zones indicator with dynamic Support/Resistance, Daily/Weekly levels, ATR-based TP/SL targets, and probability-scored signals. Identify potential reversal zones in real-time.
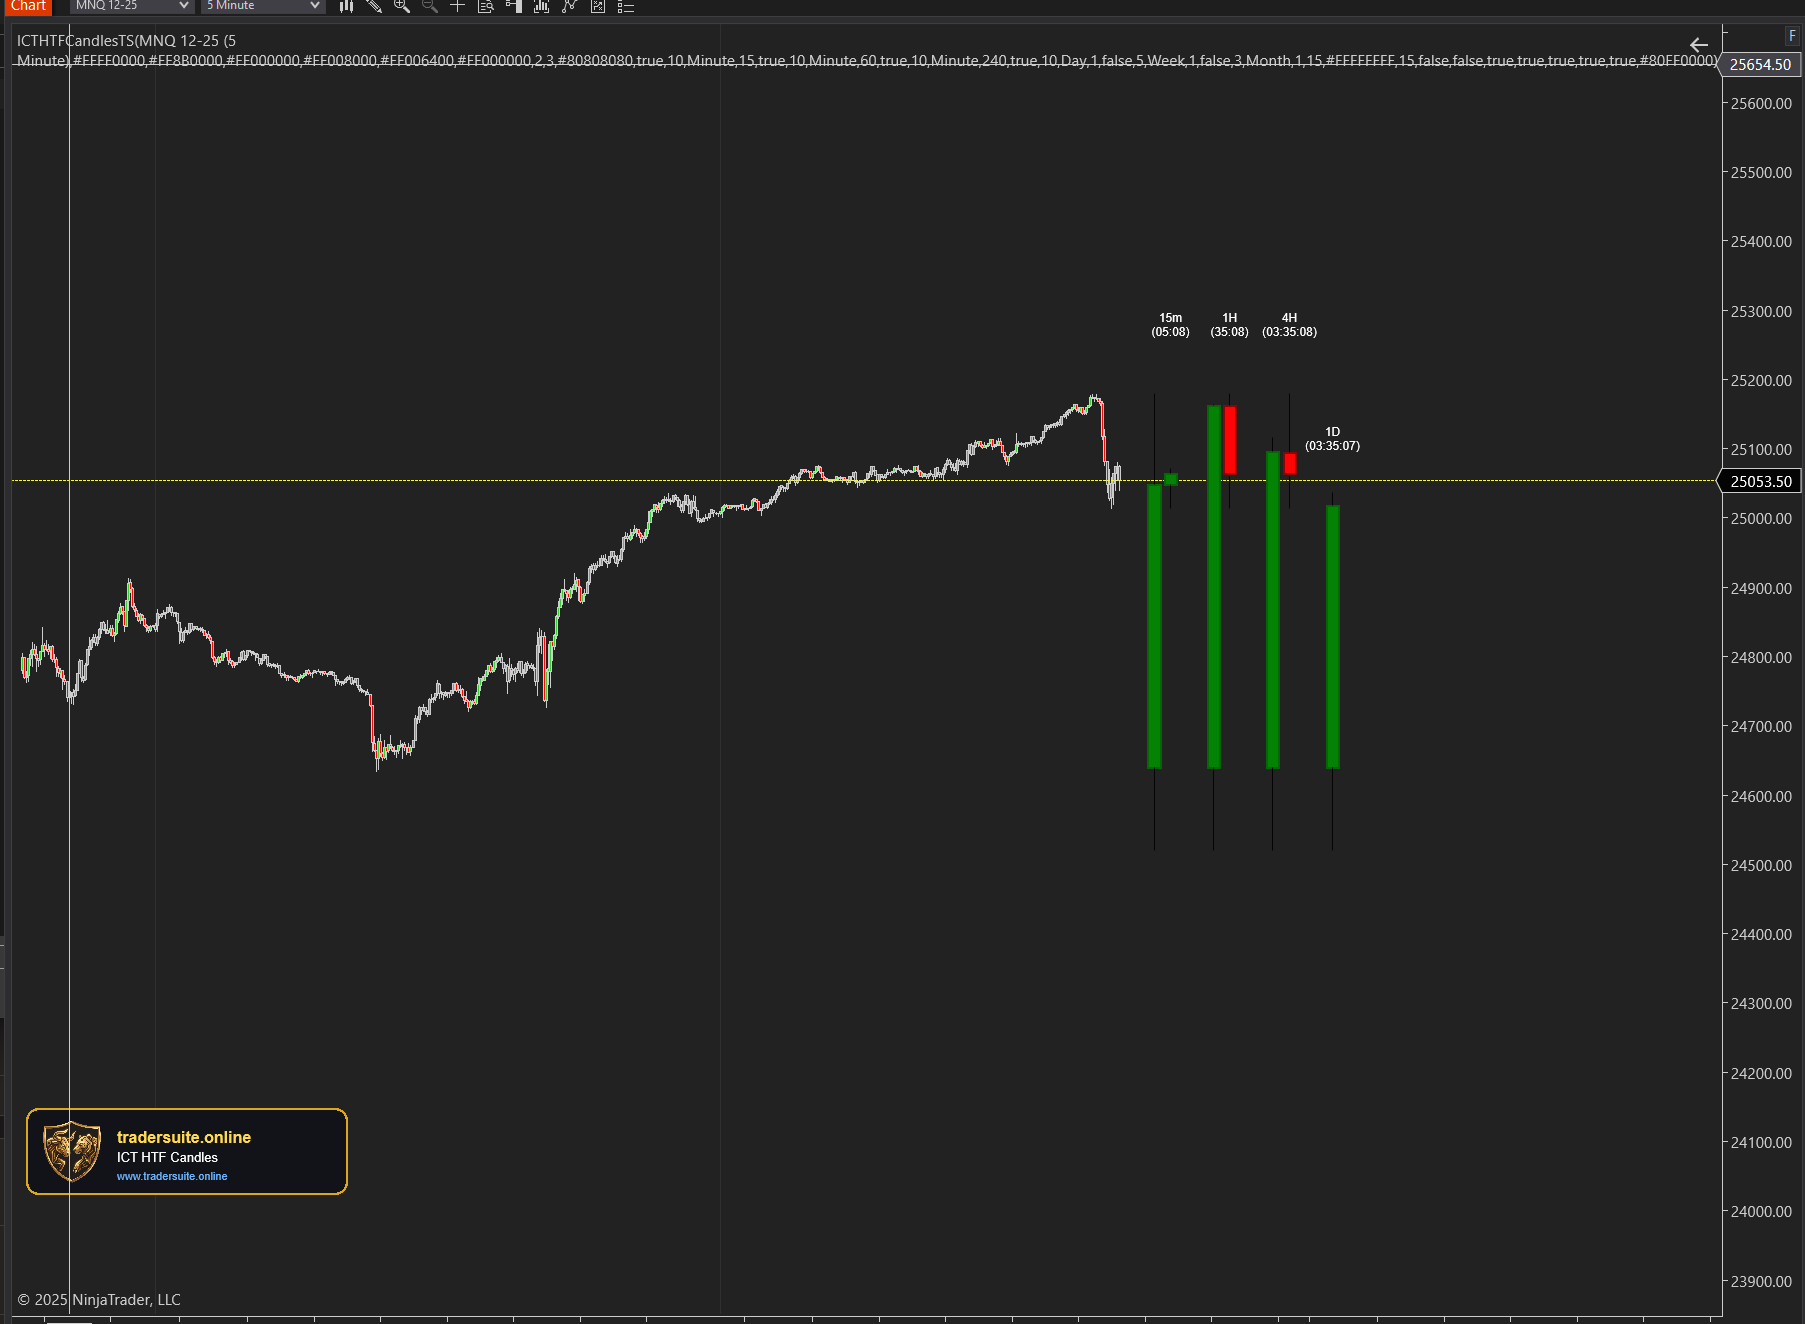
ICT HTF Candles Pro
Visualize multiple higher timeframe candles directly on your chart with real-time countdown timers, Fair Value Gap detection, and Volume Imbalance highlighting. Perfect for ICT traders who need multi-timeframe confluence without switching charts.