TS Market Compass
Trend, strength and stretch on one NinjaTrader 8 chart: BUY/SELL and STRONG signals, a trend ribbon that turns grey in a range, adaptive bands, reversals, scores and a stop with 3 targets.
Secure download
Instant access
Lifetime updates
Free forever
2 activations
Per licence
Documentation
Download user guide
Which way is the trend? Is it strong, or is the market just going sideways? TS Market Compass answers all three on one NinjaTrader 8 chart.
What you see on the chart
- BUY / SELL signals when the trend flips, and solid STRONG labels when the trend ribbon agrees.
- Trend ribbon – green in an up trend, red in a down trend, grey when the market is in a range.
- Adaptive bands with a zone inside each edge, so you can see when price is stretched.
- Reversal marks – price reaches a band zone with RSI stretched, then a candle closes back through the last one.
- Candle patterns – engulfing, hammer and shooting star, marked only at a fresh high or low or in a band zone.
- Trend score and range score (0–10) with a plain-English bias: UP TREND, DOWN TREND, RANGE or MIXED.
- Stop and three targets (1R, 2R, 3R) on every signal.
- Custom signal builder – pick a trigger and a filter. No coding.
- Optional fast band, trend-assist line and range levels (VWAP with standard-deviation levels).
Everything is worked out on closed candles, so nothing repaints. Candles can be shaded by the trend score.
TS Market Compass is a tool for reading the market and getting alerts. It is not a signal service and does not place trades. Trading futures carries a high risk of loss.
Product Demos
Related products
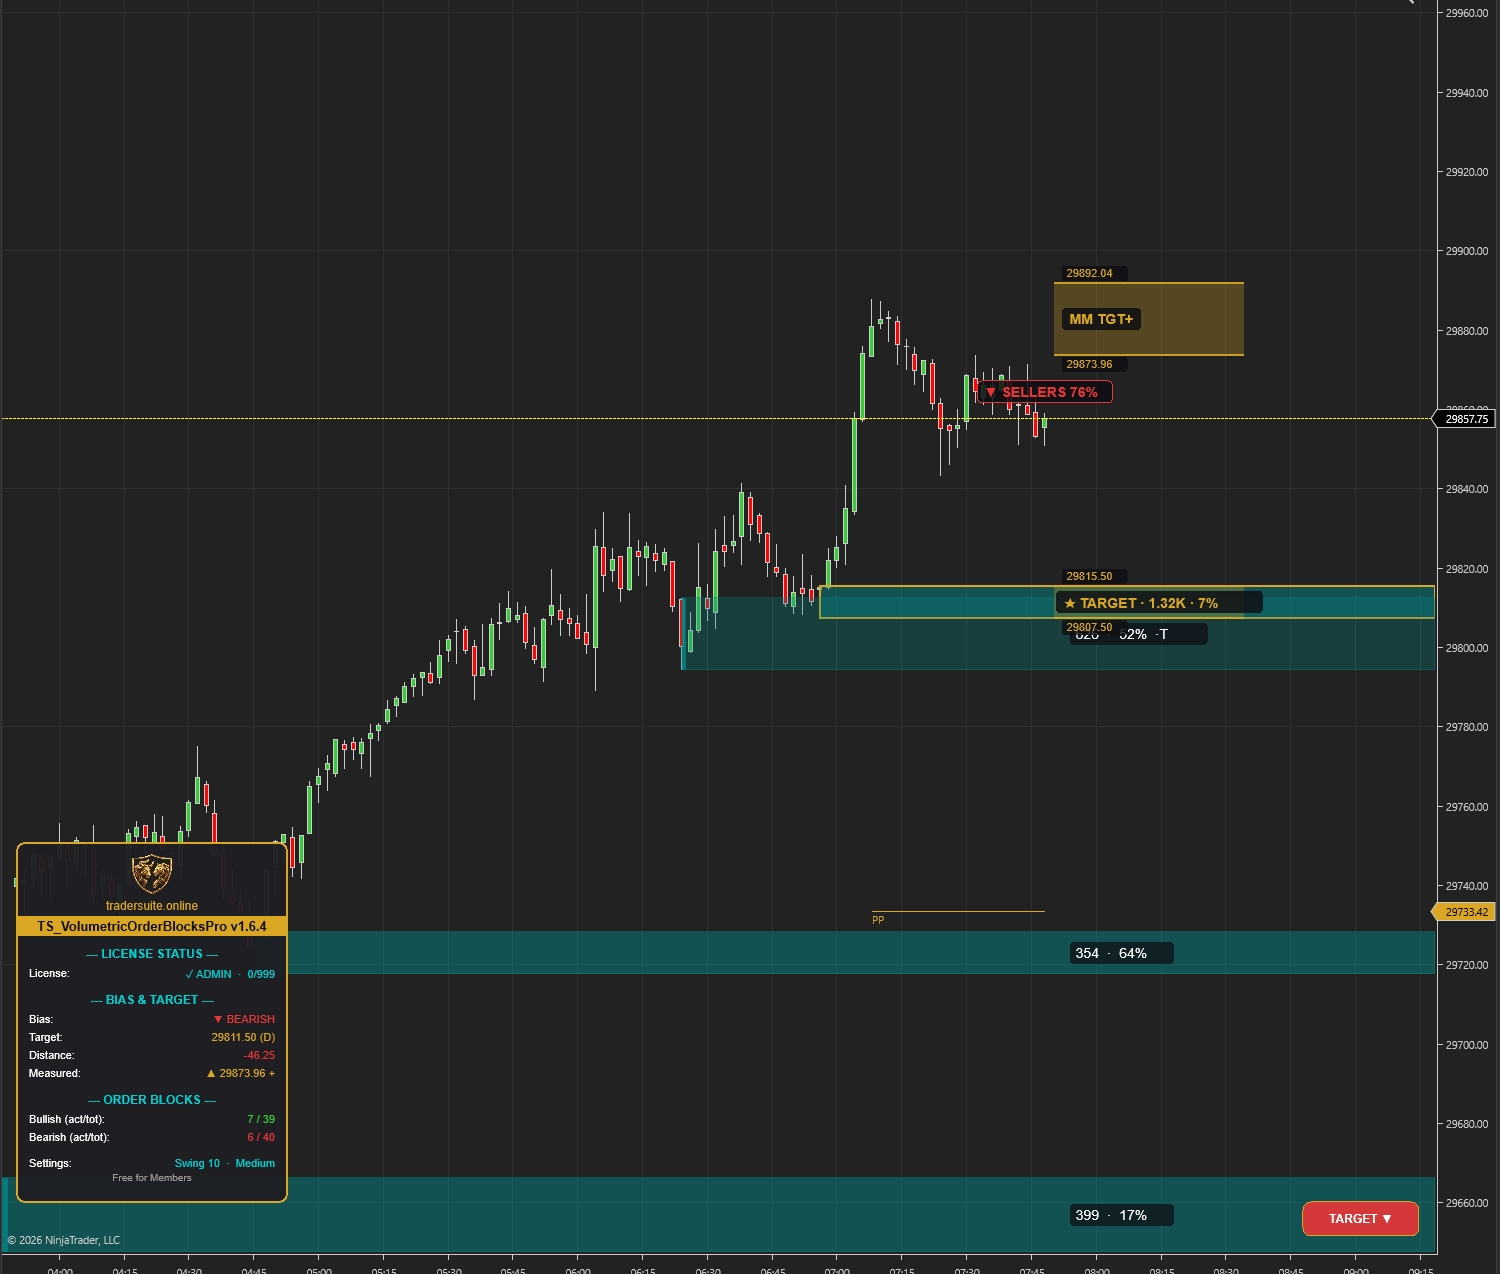
Volumetric Order Blocks Pro
Automatically detect institutional supply & demand zones with volume-weighted order blocks. Identify potential reversal zones where smart money is positioned.
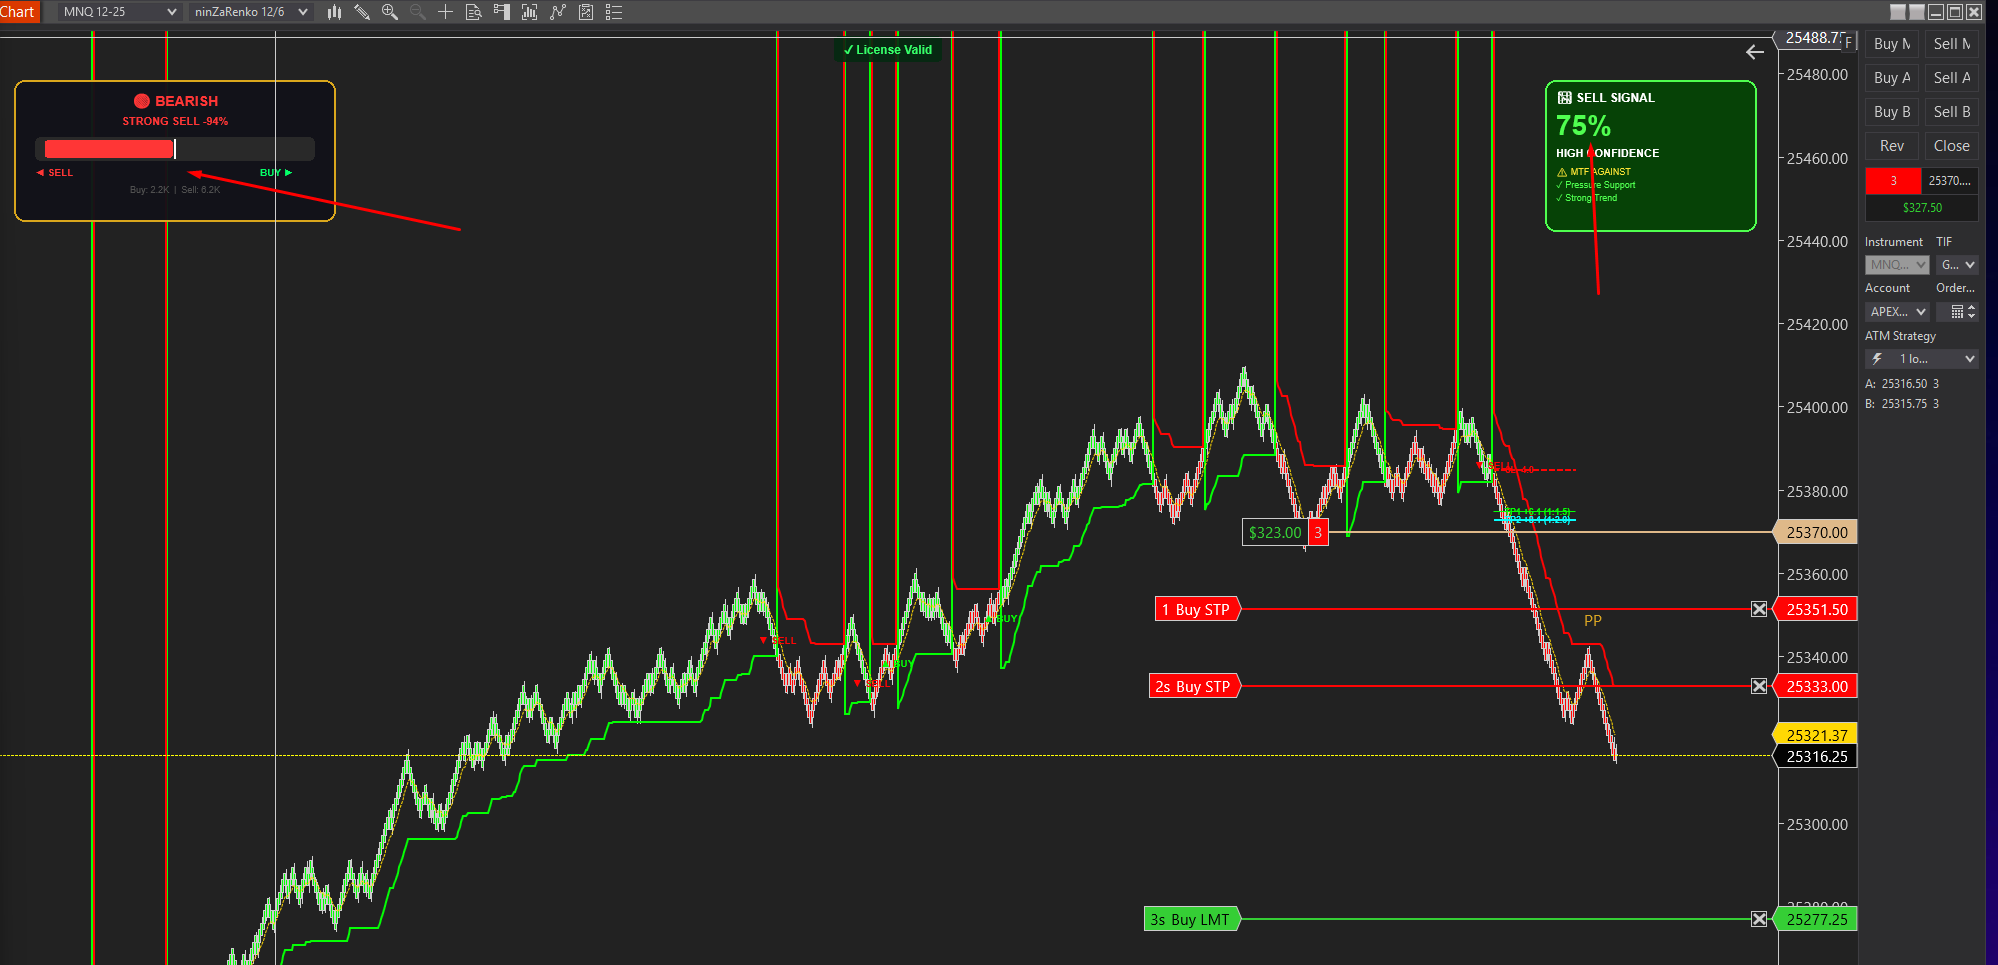
Smartflowpro
Advanced order flow analysis with real-time Pressure Delta Meter, multi-timeframe confluence scoring, and intelligent signal probability rating. Know who's in control before you trade.
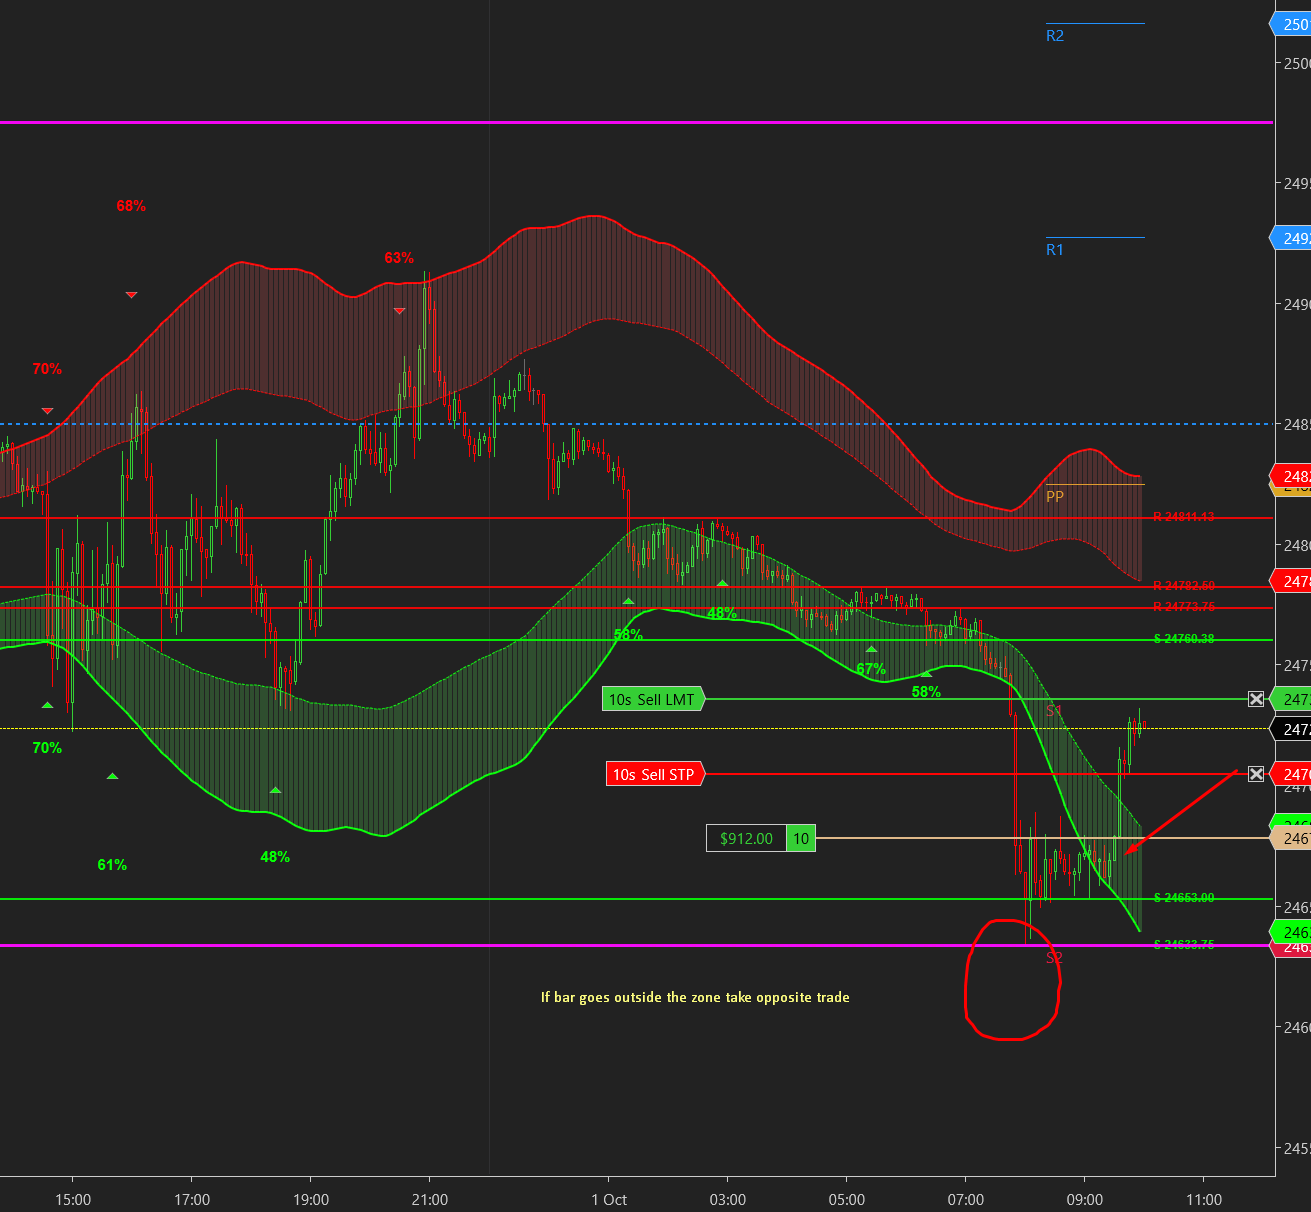
UltraADXVolatilityWaves
Professional ADX-powered volatility zones indicator with dynamic Support/Resistance, Daily/Weekly levels, ATR-based TP/SL targets, and probability-scored signals. Identify potential reversal zones in real-time.
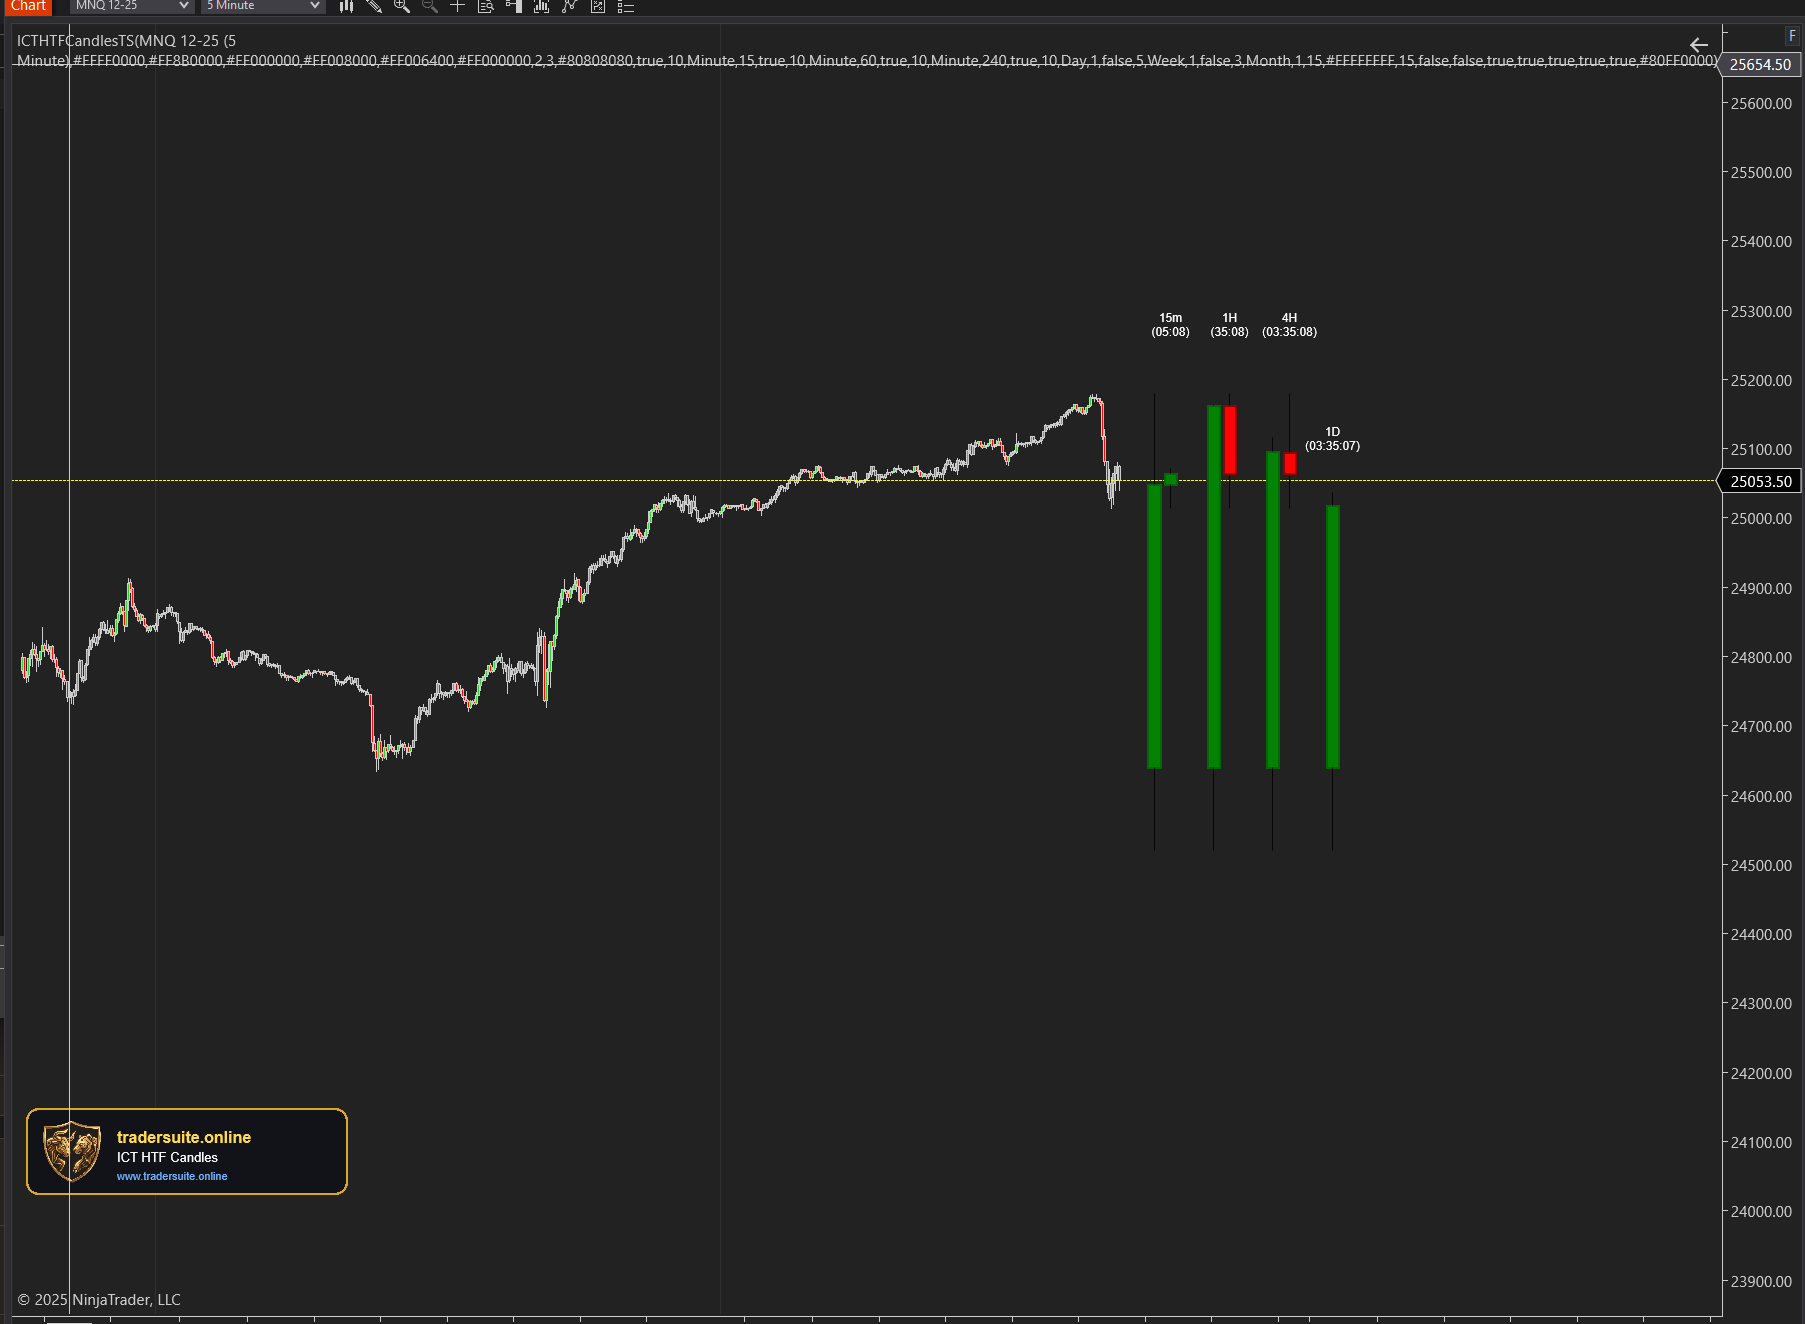
ICT HTF Candles Pro
Visualize multiple higher timeframe candles directly on your chart with real-time countdown timers, Fair Value Gap detection, and Volume Imbalance highlighting. Perfect for ICT traders who need multi-timeframe confluence without switching charts.