TS IV Compass – Expected Move & Implied Volatility
The options market's expected move for today, drawn as bands on your NQ and ES chart. Day type (quiet, normal or wild), a range-used gauge, and the fear readings: IV, skew, term and IV rank.
Secure download
Instant access
Lifetime updates
Free forever
2 activations
Per licence
Documentation
Download user guide
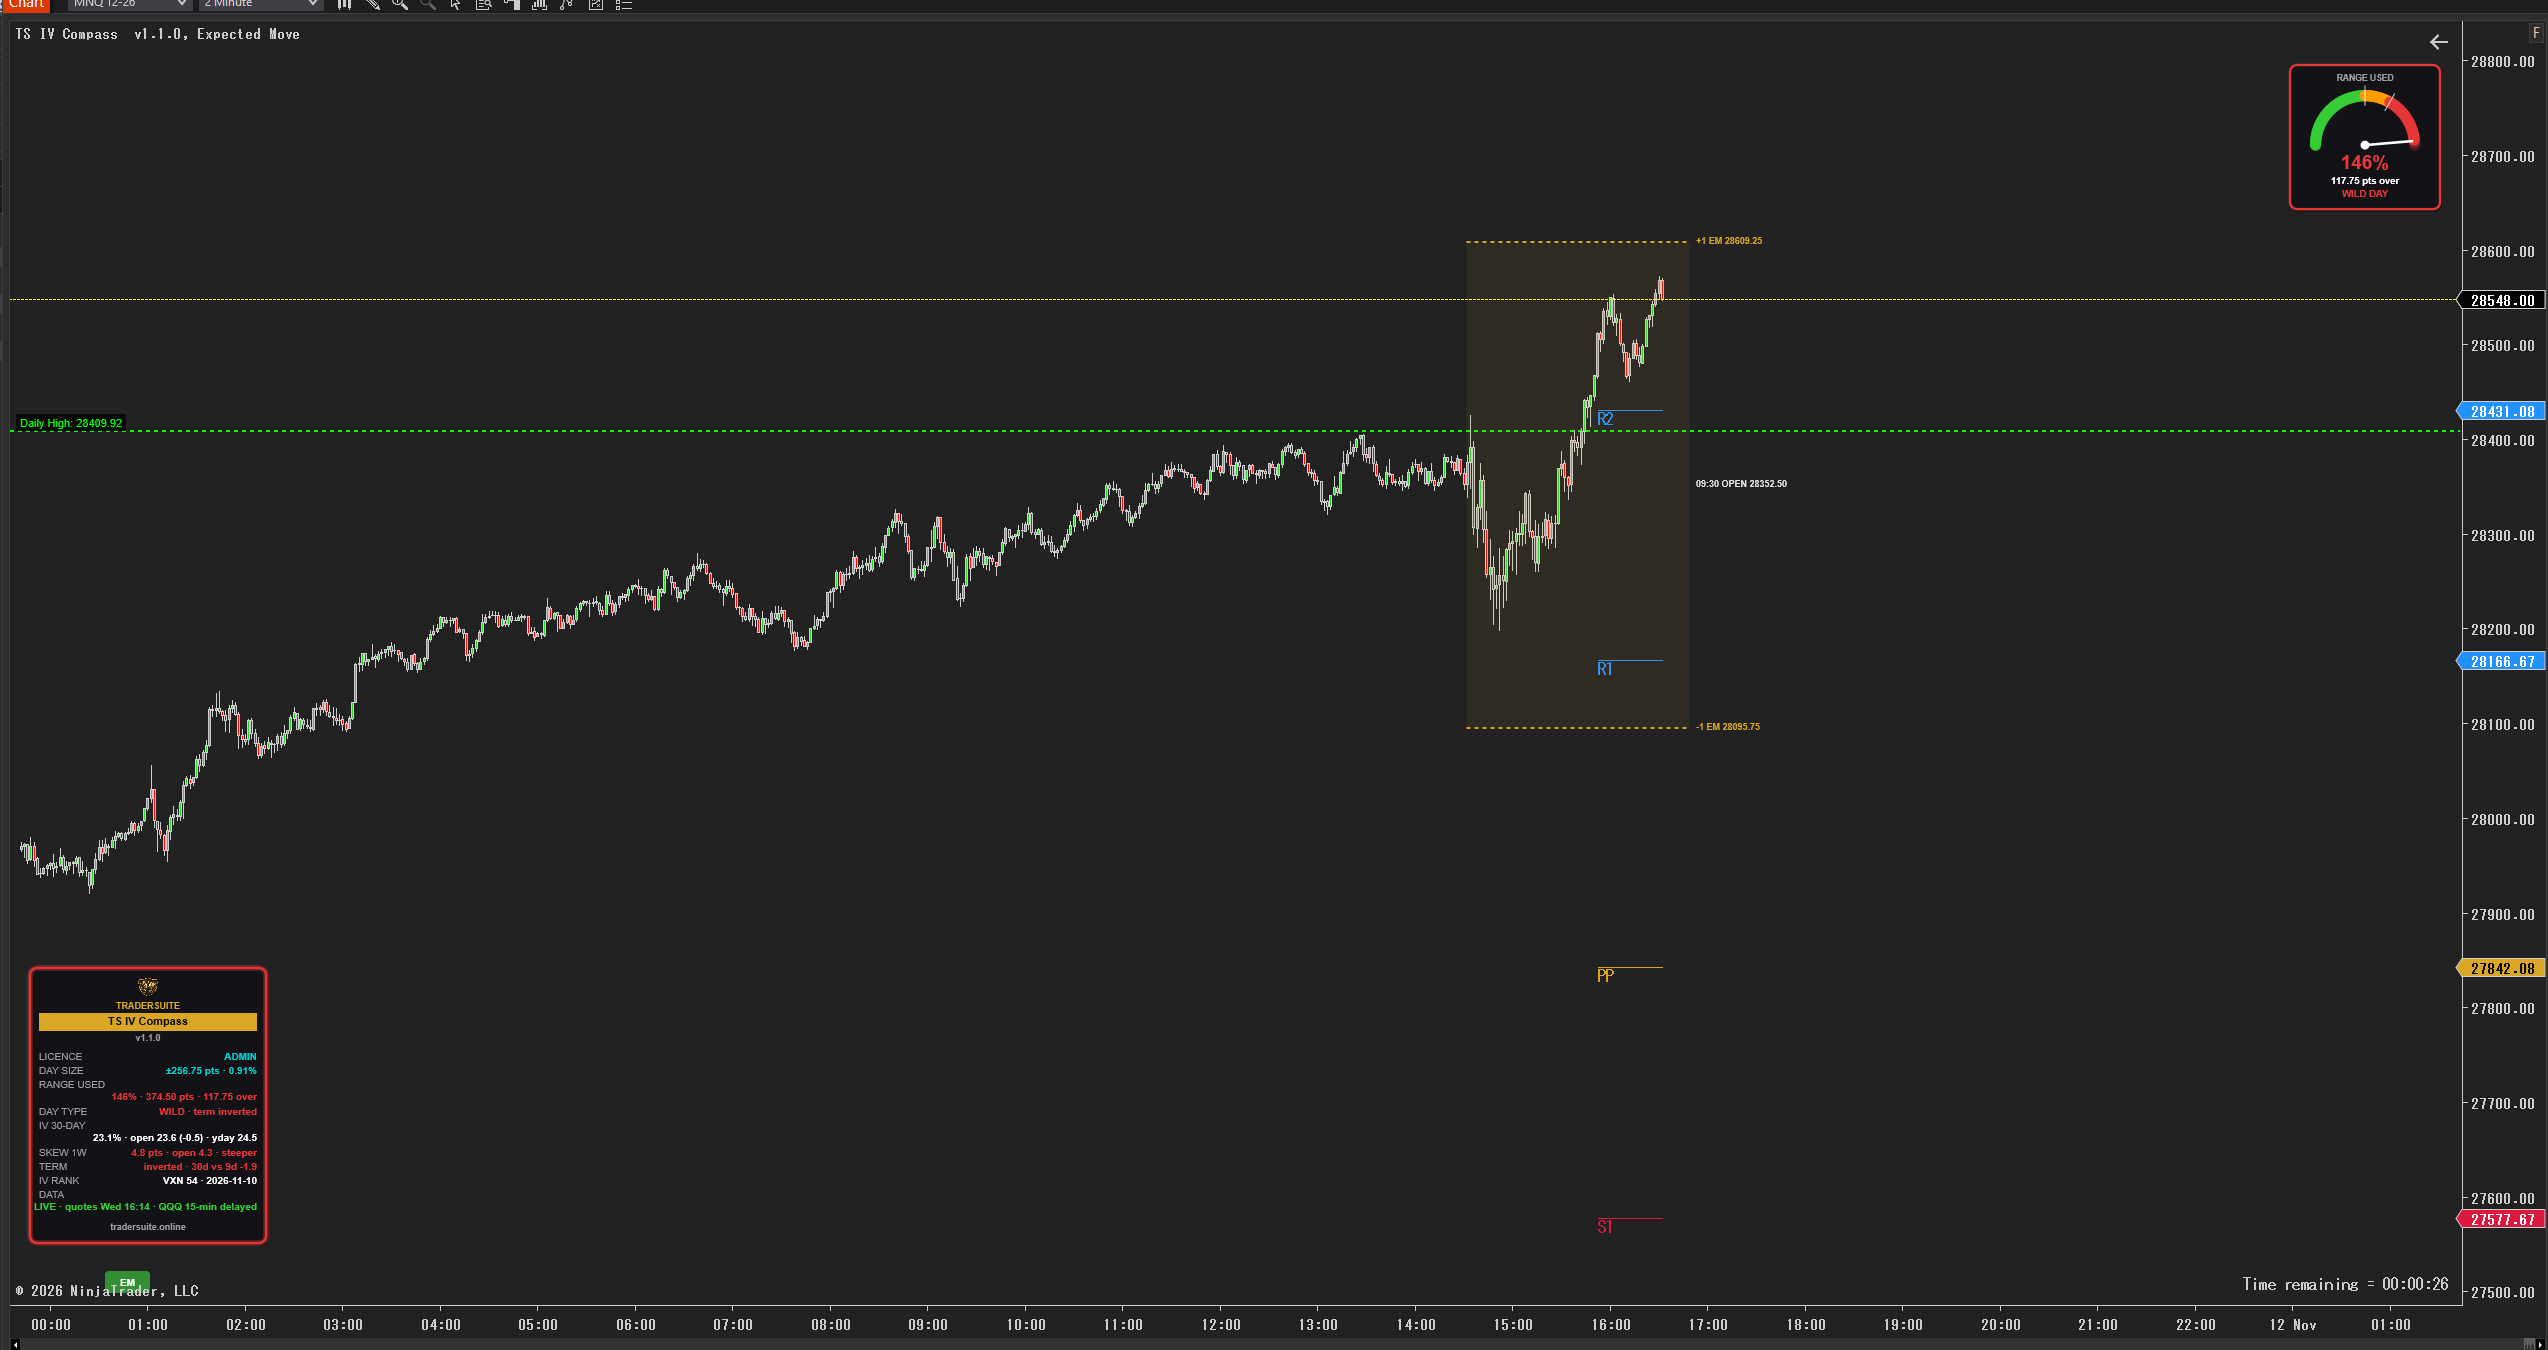
How big a day is the options market expecting? TS IV Compass reads it from the option prices and draws it on your NinjaTrader 8 chart, so you can plan stops, targets and size before you trade.
What you see on the chart
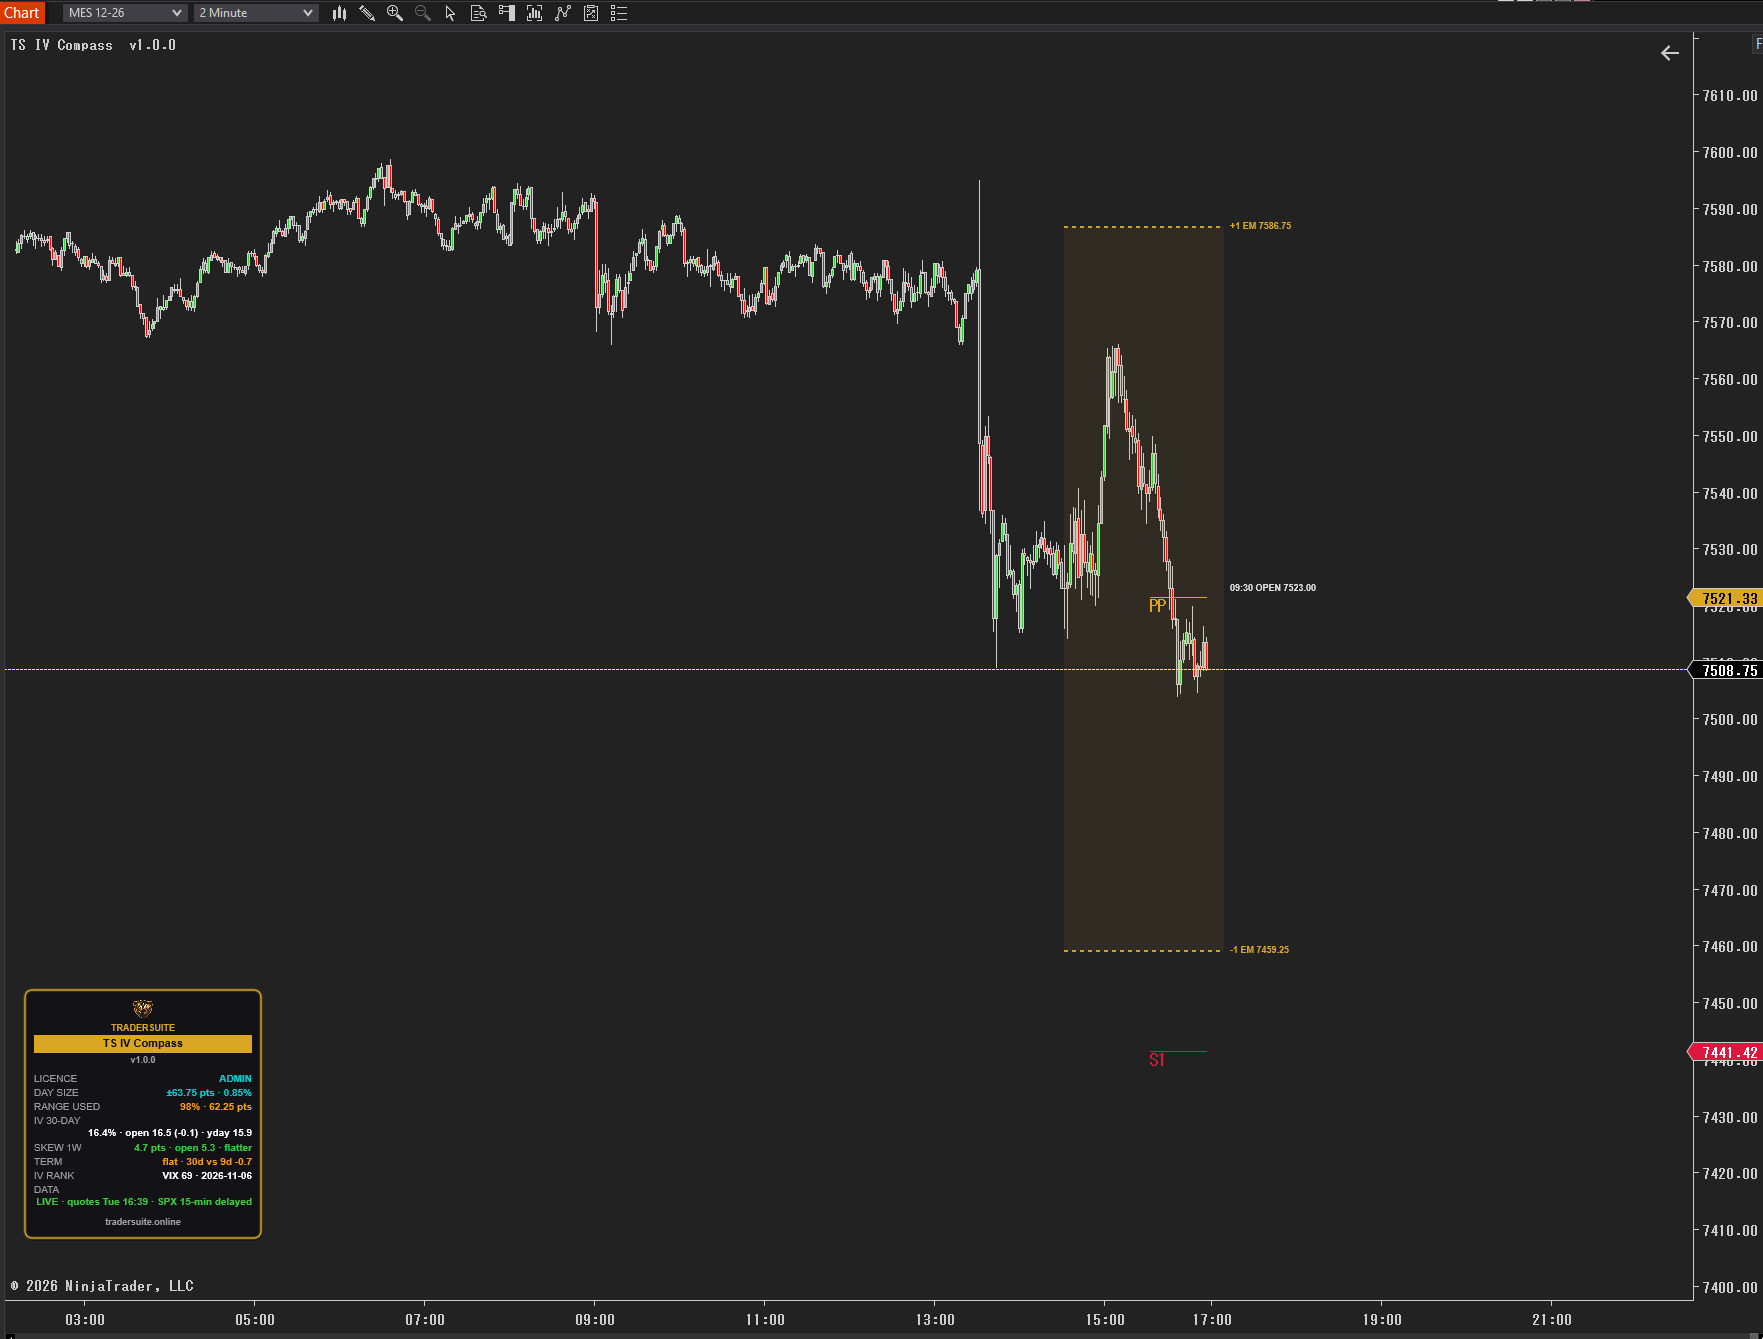
- Expected-move bands – today's 09:30 open ± the move the options market prices for the session (one standard move), locked at the open.
- Day type – QUIET, NORMAL or WILD, worked out from the day size, the term shape and the IV rank. The panel border takes its colour.
- Range gauge – a small fuel gauge: how much of the expected move the day has already used, and the points left.
- Fear readings – 30-day IV now vs the open and vs yesterday, the 1-week skew, the term shape (normal / flat / inverted) and the IV rank (VIX for ES, VXN for NQ).
- Rich strikes – option strikes where traders are paying well over the odds, shown as futures prices.
- Alerts – IV crush or climb, the day type, and range used reaching your caution level or 100 %.
The data comes from Cboe's delayed option chains (about 15 minutes old) through the TraderSuite server: SPX / SPY options for ES and MES, QQQ / NDX options for NQ and MNQ. Everything is worked out on closed candles. It is built for the plan before the bell and the slow changes through the day, not for split-second entries.
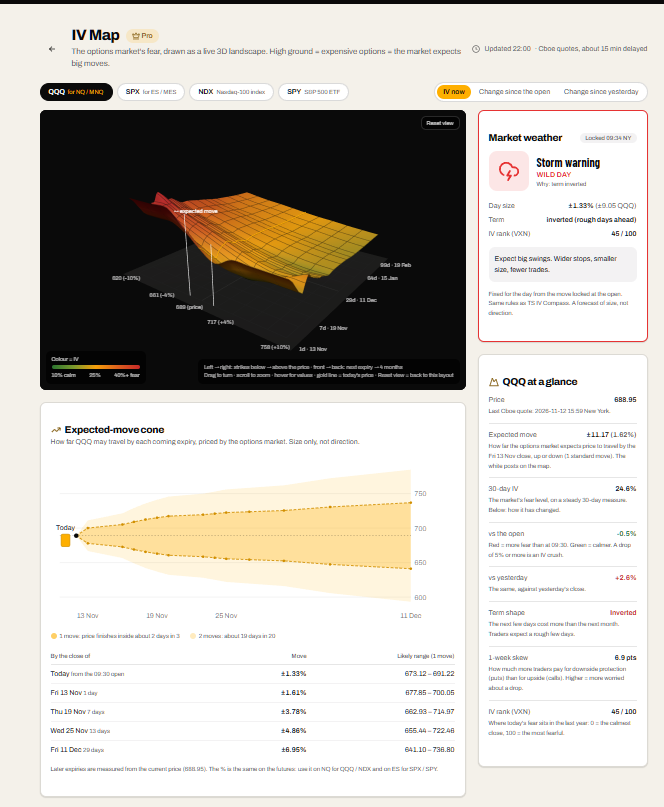
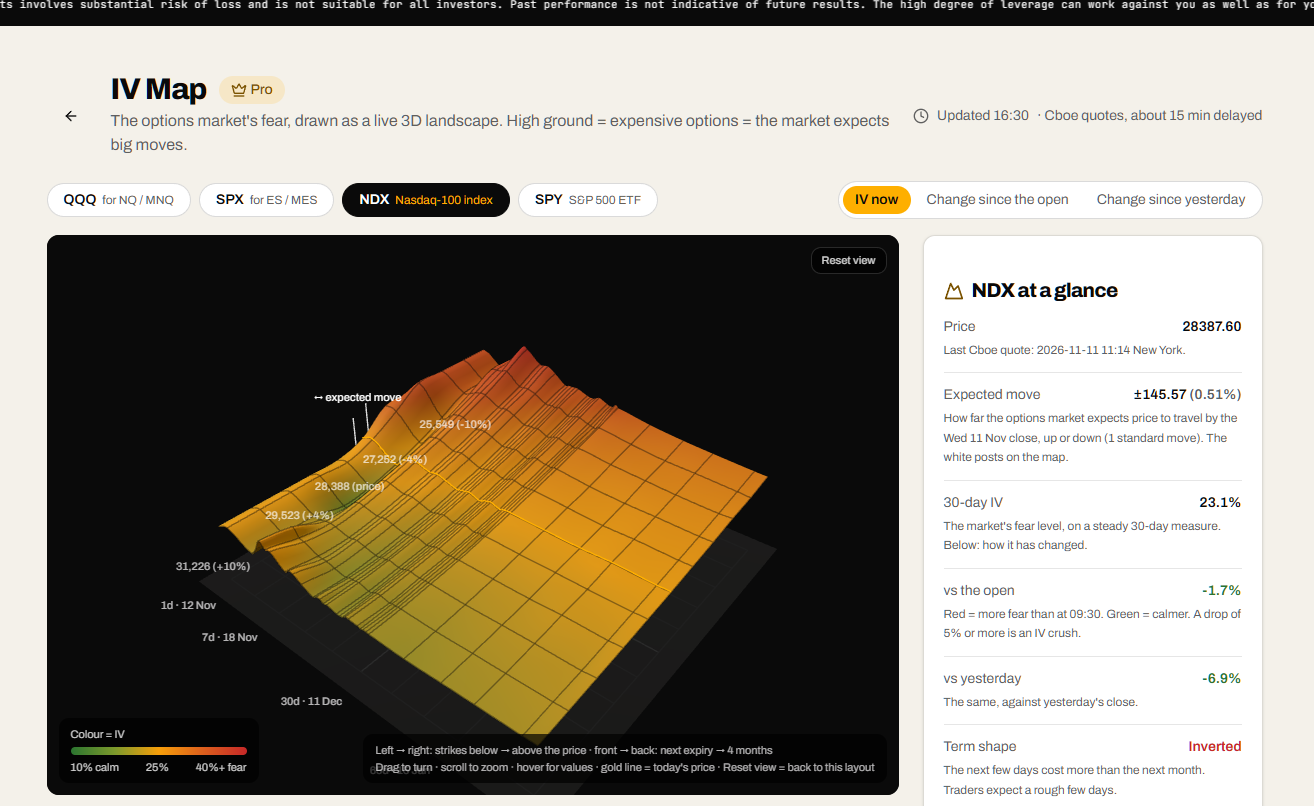
Pro members can also open the IV Map on the website: the same data as a live 3D landscape, with the market weather card and the expected-move cone.
TS IV Compass shows the size of the move the market expects, not its direction. It is a tool for reading the market and getting alerts. It is not a signal service and does not place trades. Trading futures carries a high risk of loss.
Product Demo
Related products
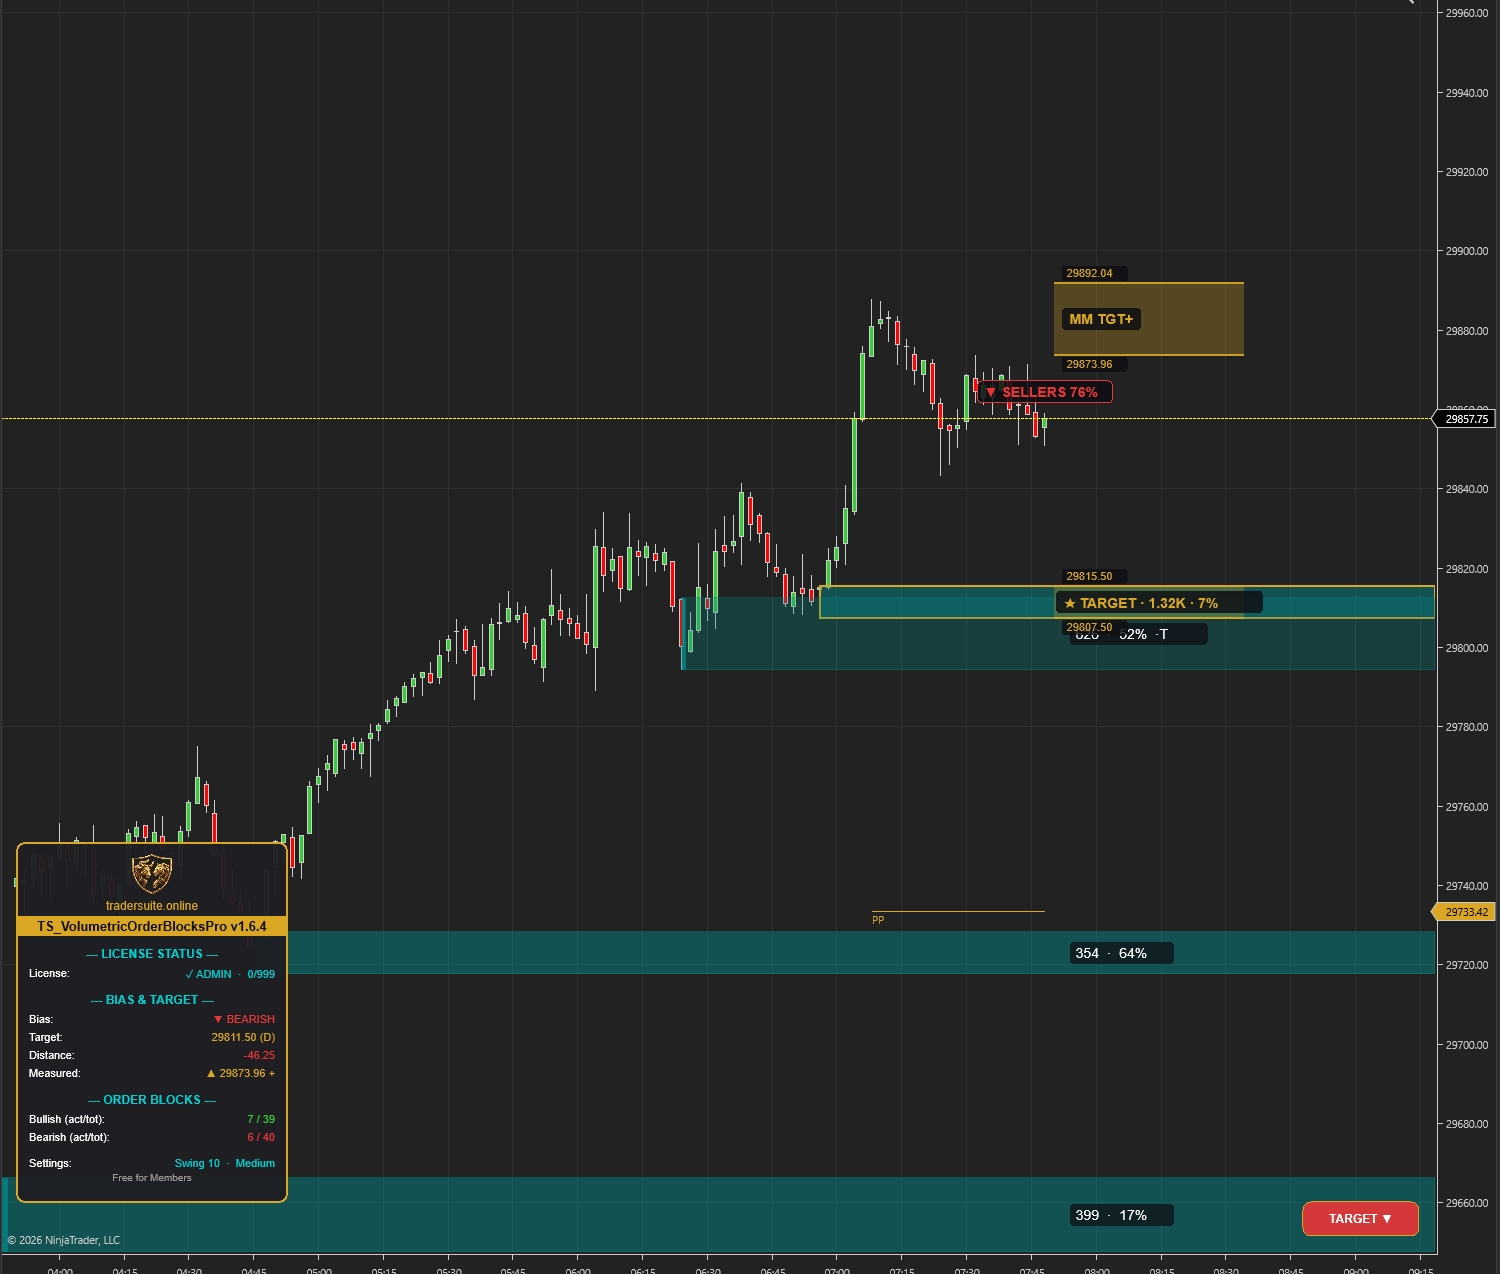
Volumetric Order Blocks Pro
Automatically detect institutional supply & demand zones with volume-weighted order blocks. Identify potential reversal zones where smart money is positioned.
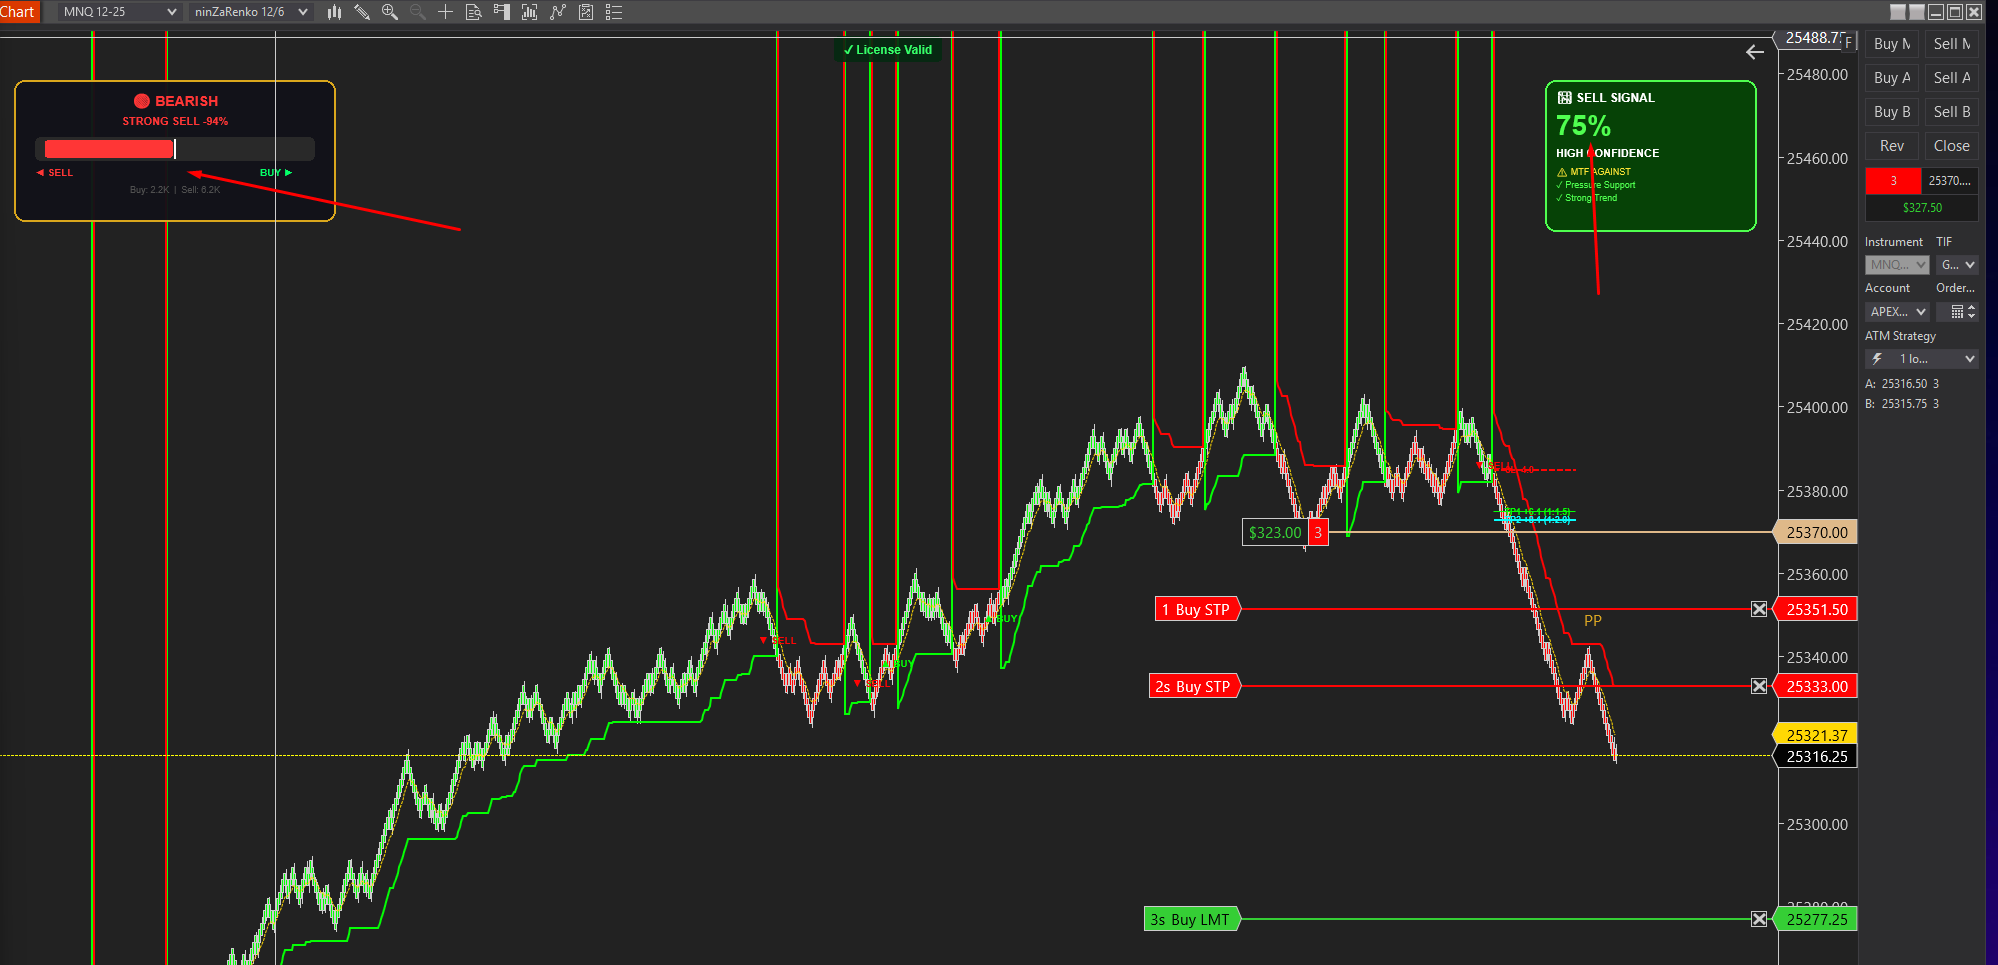
Smartflowpro
Advanced order flow analysis with real-time Pressure Delta Meter, multi-timeframe confluence scoring, and intelligent signal probability rating. Know who's in control before you trade.
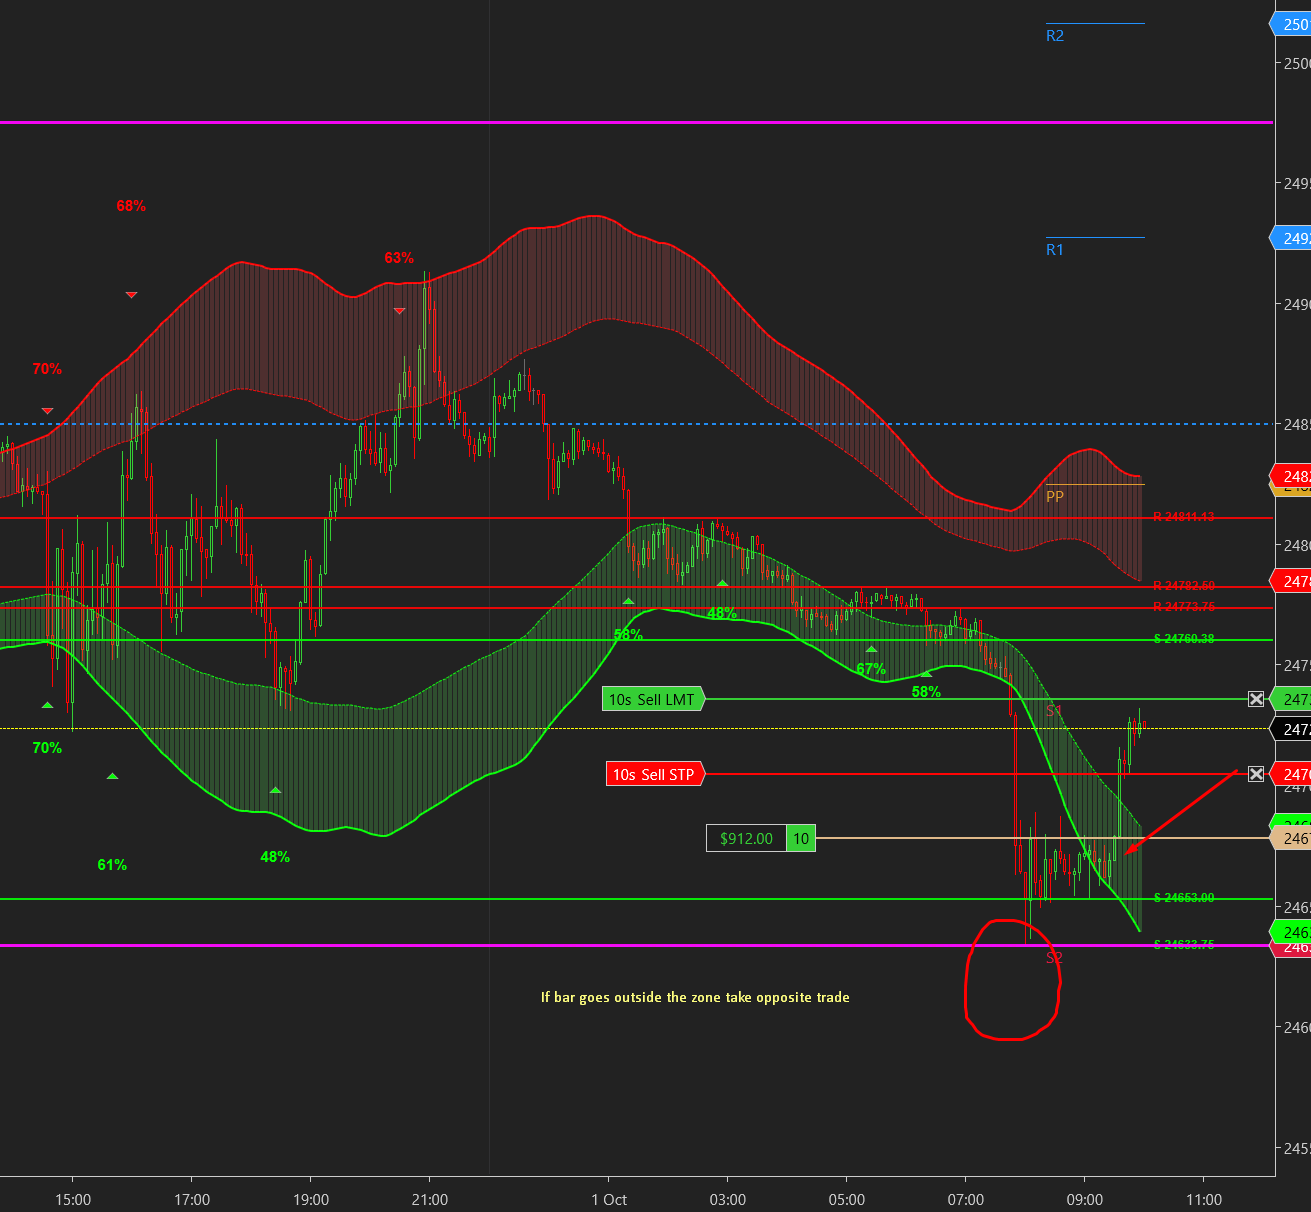
UltraADXVolatilityWaves
Professional ADX-powered volatility zones indicator with dynamic Support/Resistance, Daily/Weekly levels, ATR-based TP/SL targets, and probability-scored signals. Identify potential reversal zones in real-time.
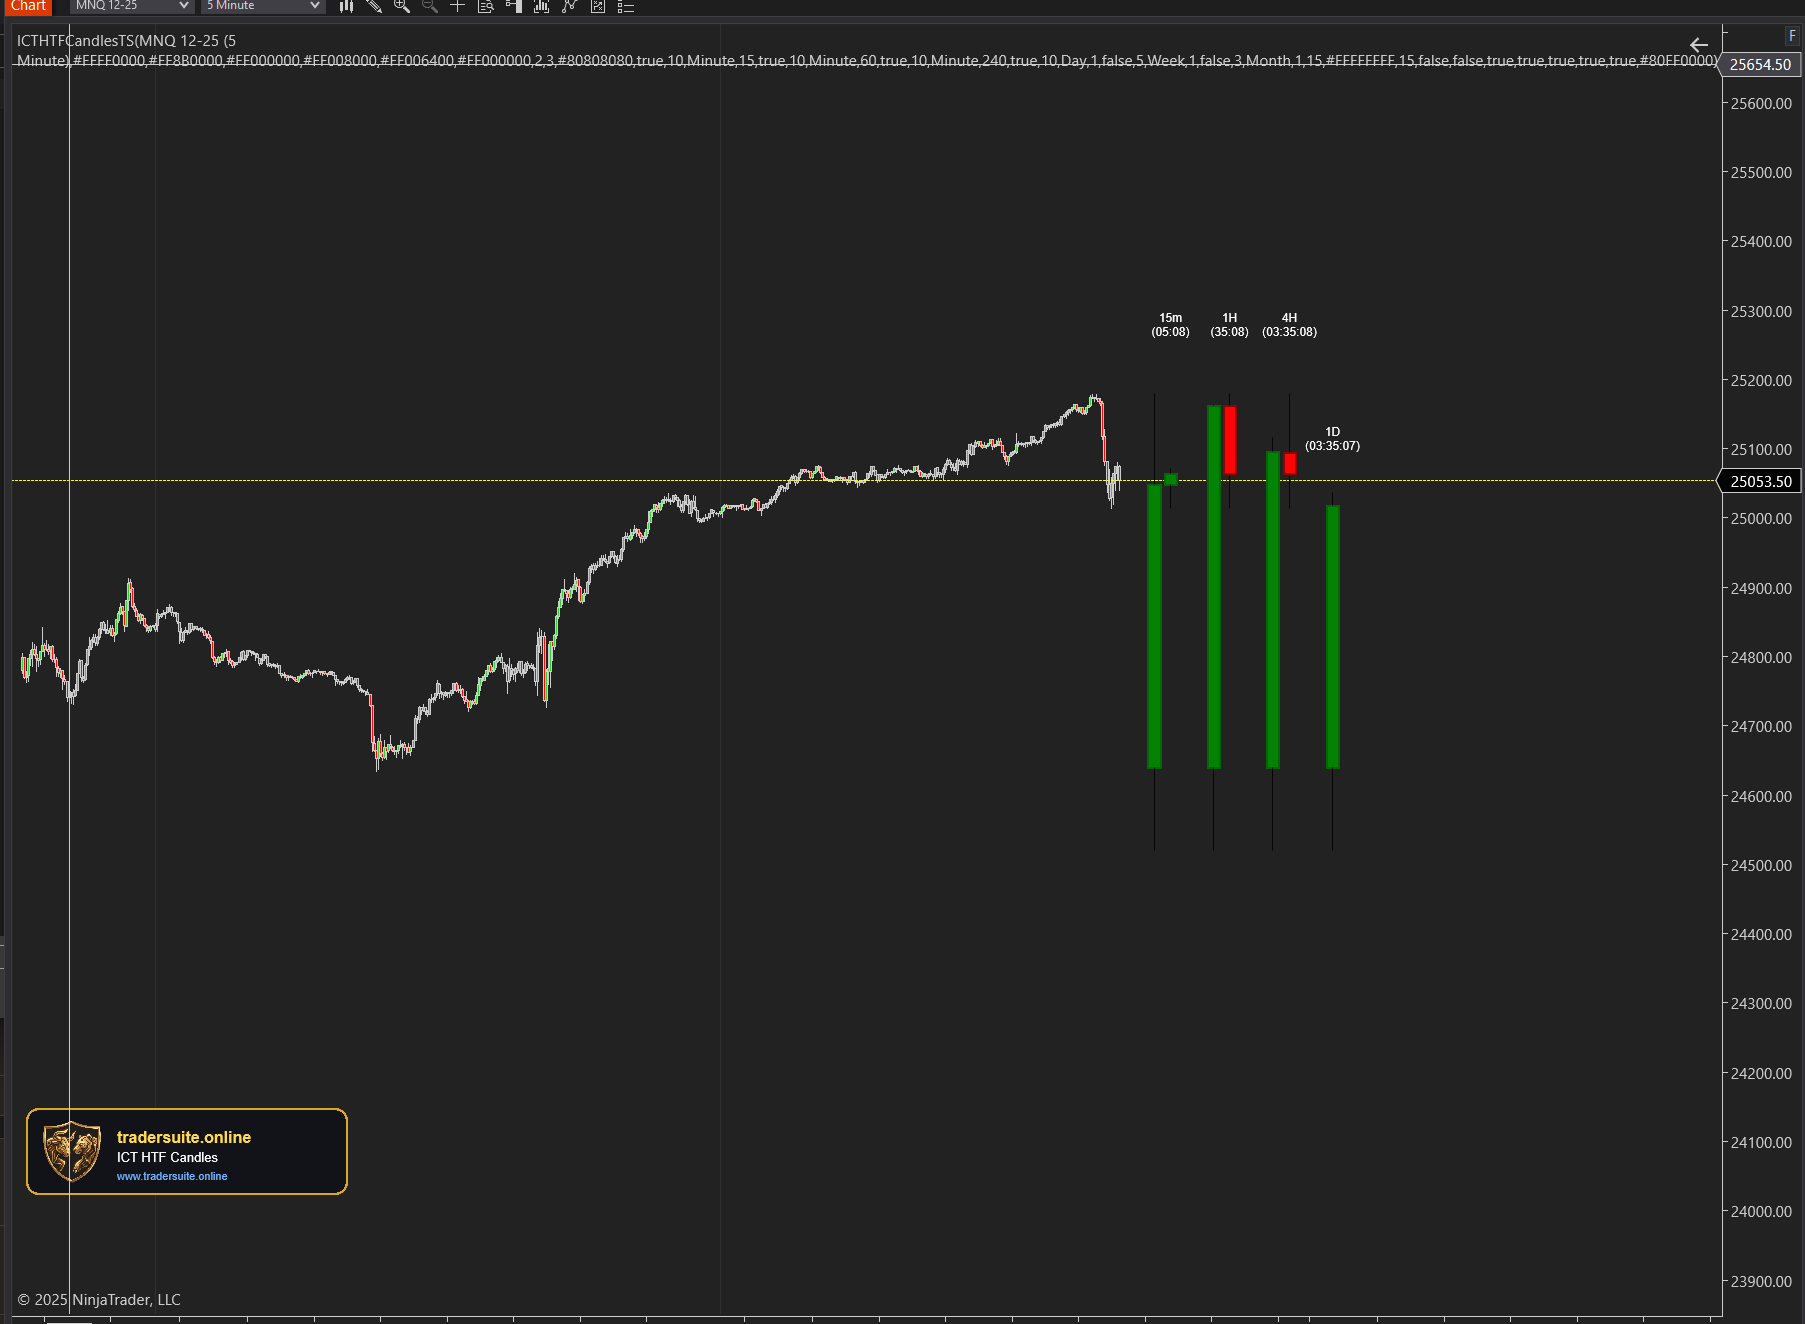
ICT HTF Candles Pro
Visualize multiple higher timeframe candles directly on your chart with real-time countdown timers, Fair Value Gap detection, and Volume Imbalance highlighting. Perfect for ICT traders who need multi-timeframe confluence without switching charts.