AMD Po3 Pro - Accumulation/manipulation/distribution
Detects the Accumulation → Manipulation → Distribution cycle with a strict state machine, measures every completed cycle in R against a fixed reference trade, and keeps the record on disk — so you find out whether the pattern actually pays on your instrument instead of taking someone's word for it.
Secure download
Instant access
Lifetime updates
Free forever
2 activations
Per licence
Documentation
Download user guide
Most pattern indicators tell you what to look for. This one tells you whether it worked.
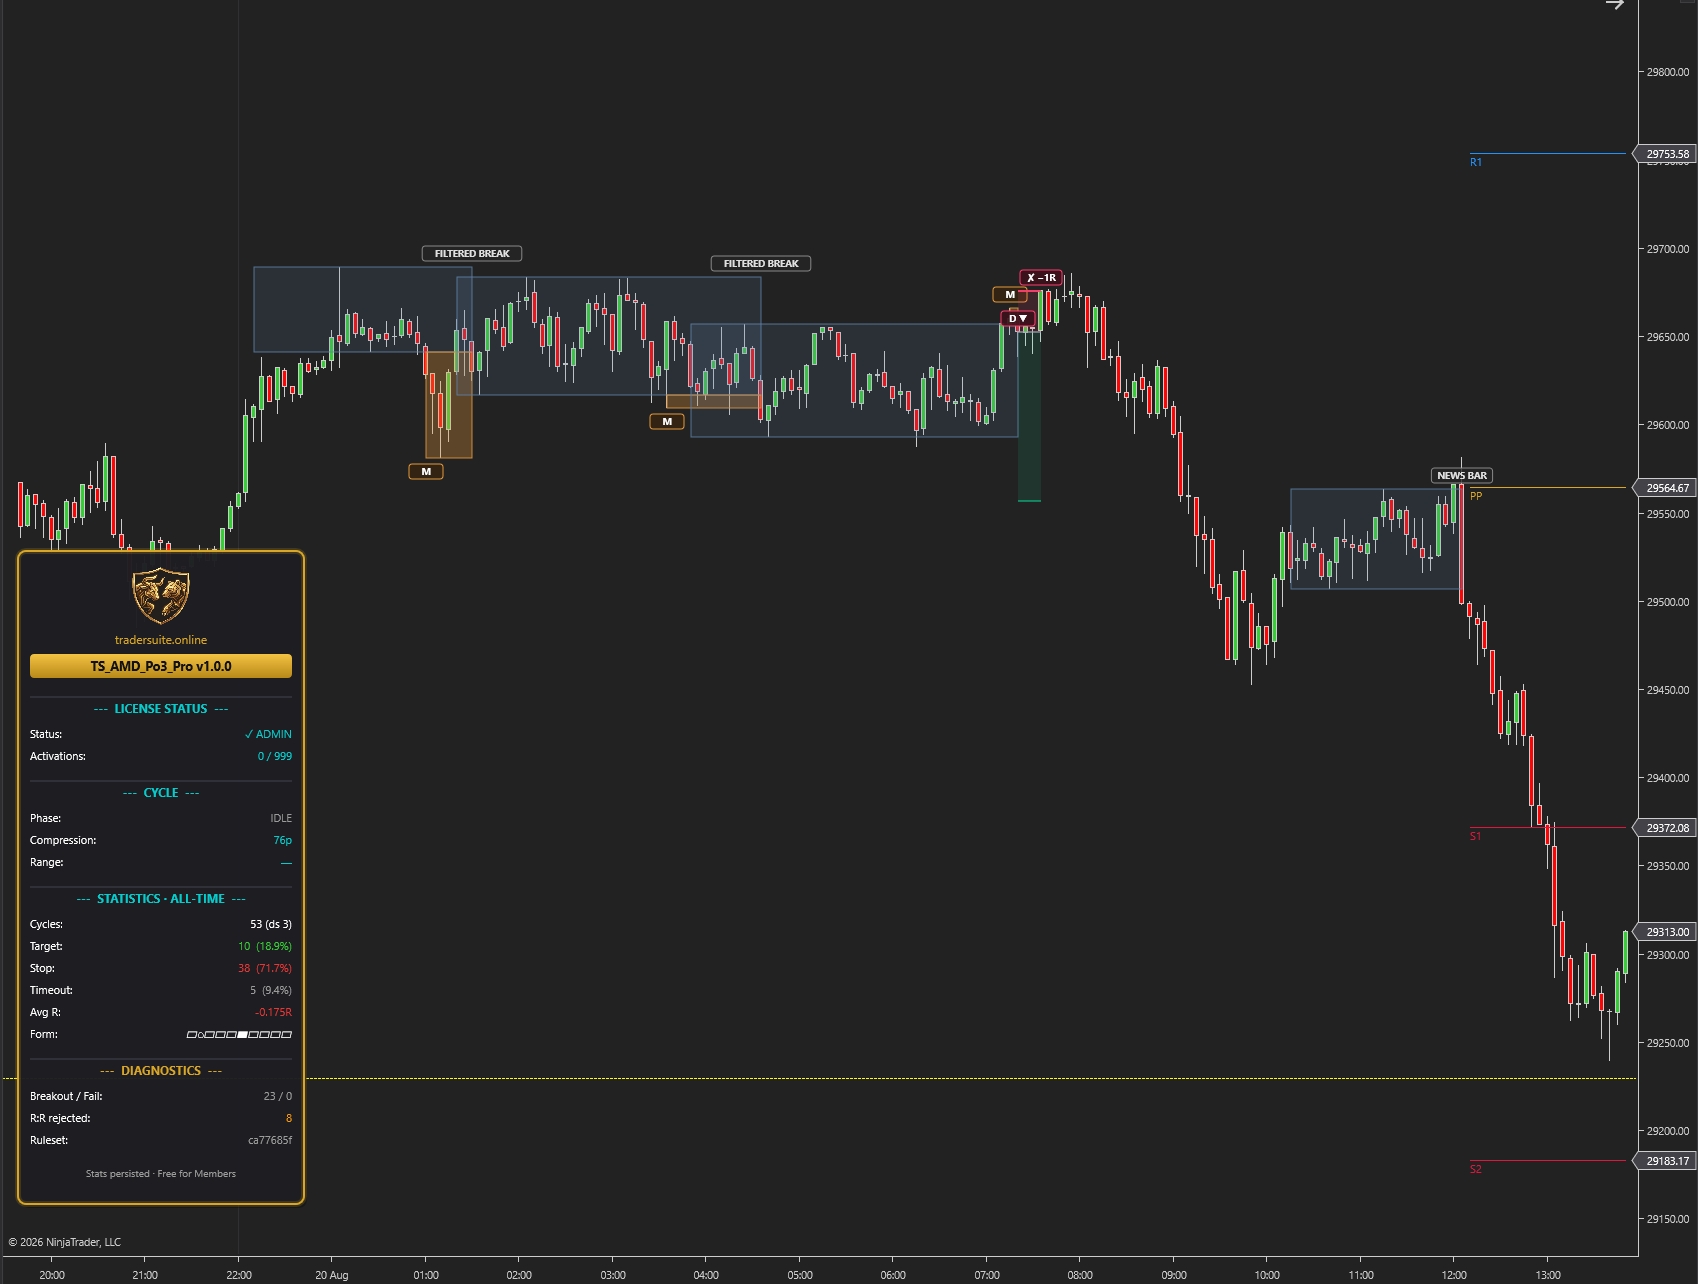
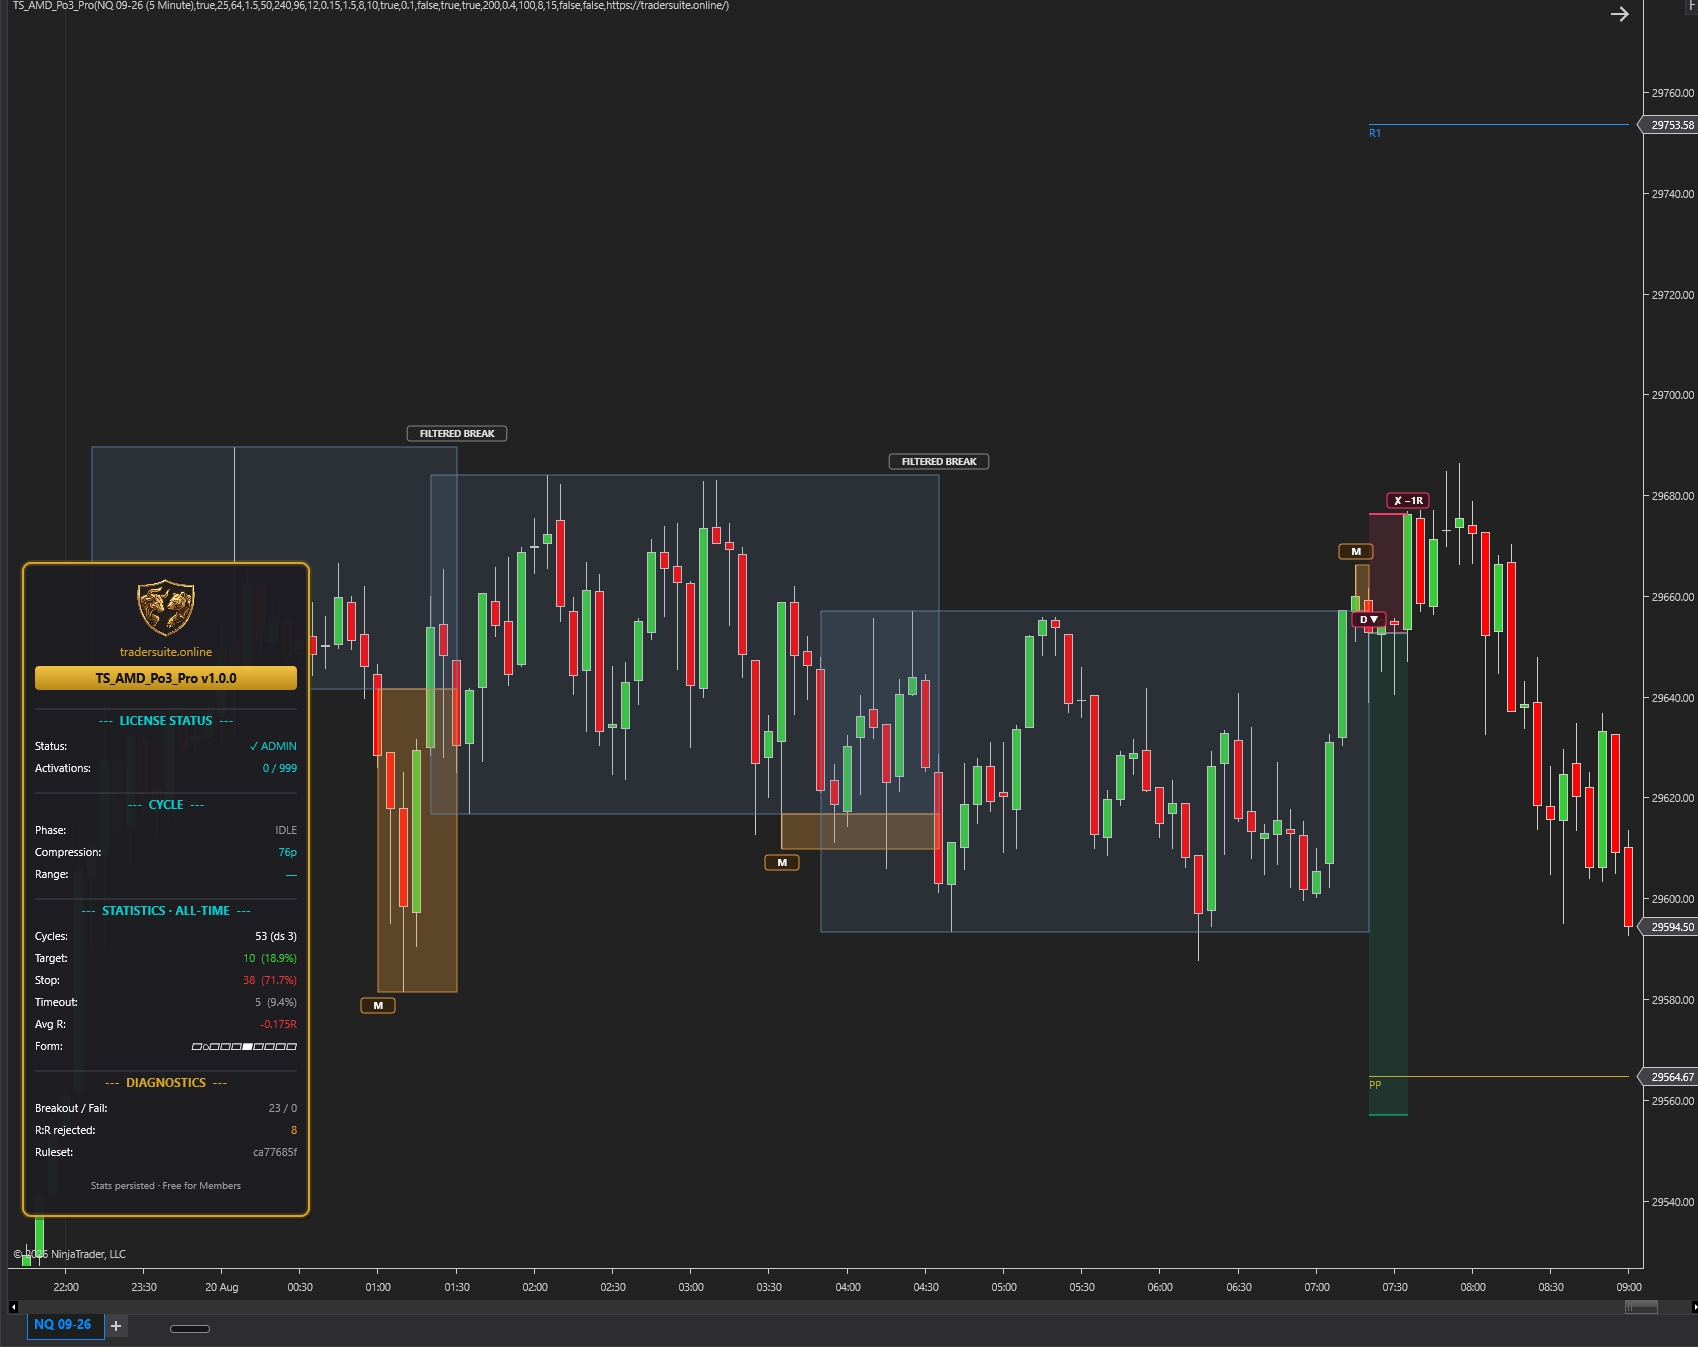
AMD Po3 Pro finds the three-act structure that precedes many intraday reversals — a market that goes quiet and builds a range (accumulation), price poking out of that range far enough to trigger the stop orders resting beyond it and then snapping back inside (manipulation), and the real move running the other way through the range and out the far side (distribution).
What makes it different is what happens next. Every detected cycle is attached to a complete reference trade — entry, stop and target, all fixed on the bar the manipulation confirms, using only data that has already printed. When the cycle resolves, the outcome is scored in R and written to disk. Reload the chart, restart NinjaTrader, come back next week: your sample is still there and still growing.
An honest scoreboard, not a marketing claim
The statistics panel shows closed cycles, target / stop / timeout counts, and average R for the current instrument, timeframe and rule set. Percentages stay hidden until a minimum sample has actually accumulated, because a win rate built on four trades is noise dressed as insight. Ambiguous bars — where price touched both the target and the stop and the data cannot say which came first — are always scored as losses, so your live results have room to be better than the panel, never the other way round.
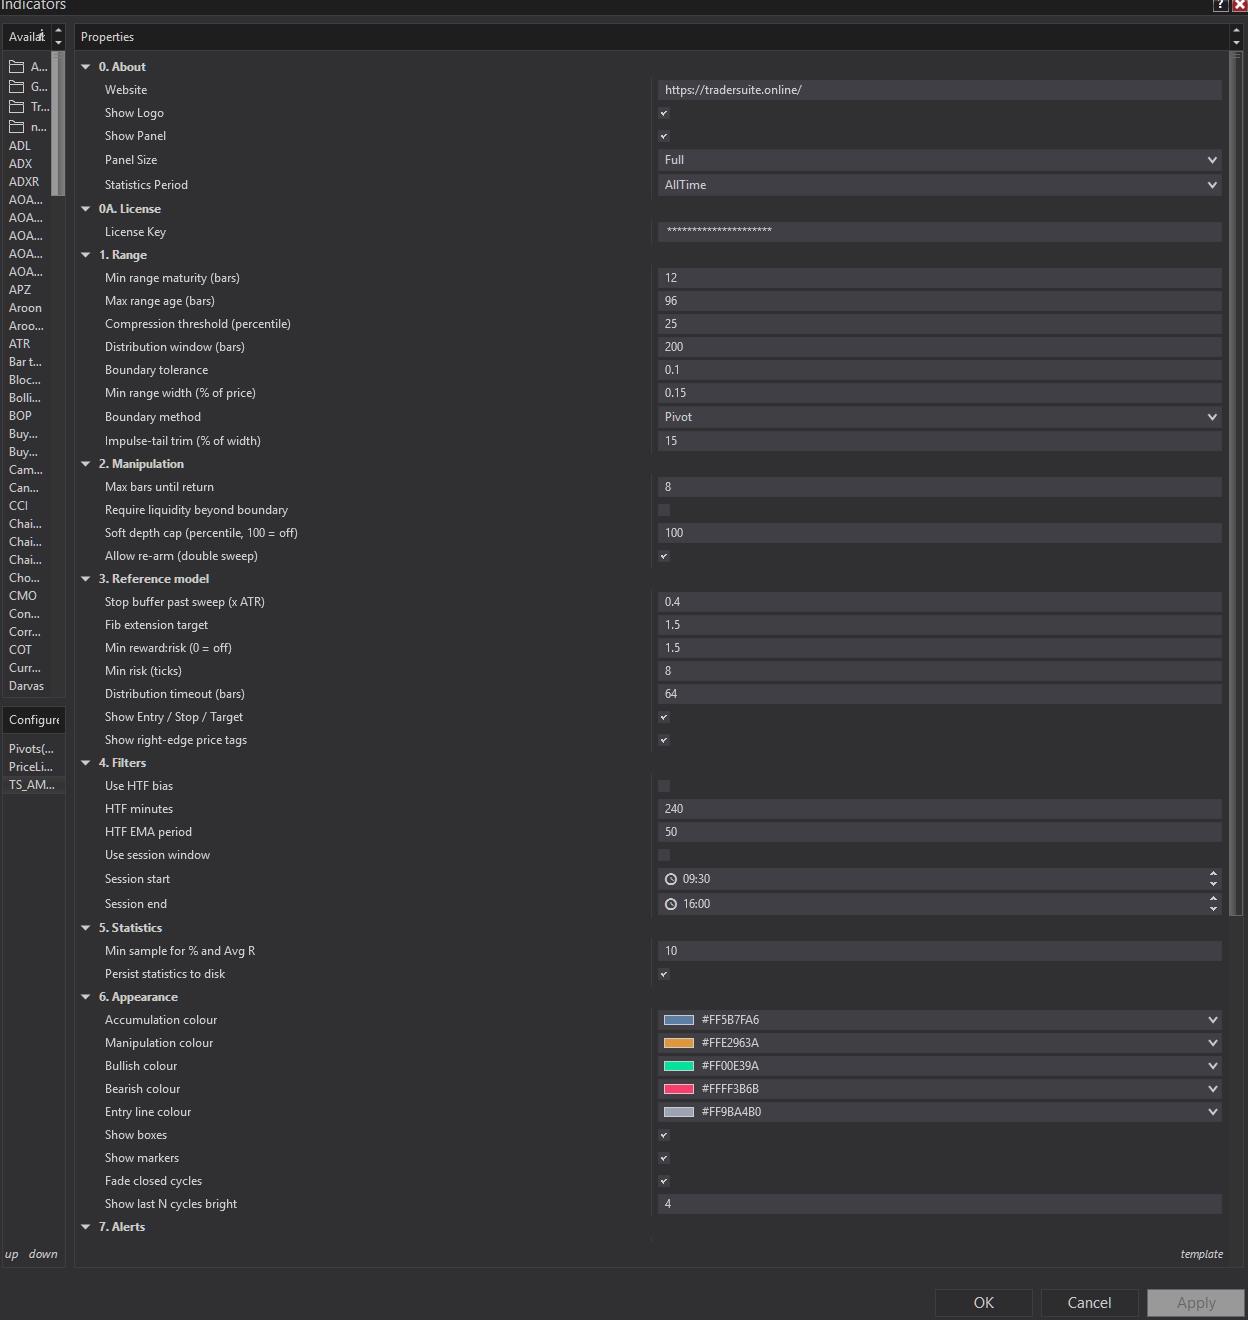
Change any engine setting and the indicator starts a clean statistics file under a new rule-set fingerprint. Your old sample is preserved, not overwritten, and two different rule sets can never be averaged into one meaningless number.
Built as a corrected implementation, not a copy
The reference concept had four measurement problems. All four are fixed here: range boundaries are clamped so one can never be drawn inside price that has already printed; a minimum reward:risk gate refuses the poor-geometry setups that look identical on the chart but pay a third as much; a minimum risk floor stops a degenerate setup from registering a fictional double-digit +R that flatters the average; and statistics persist to disk instead of dying on every reload.
What you get
- Non-repainting detection — everything evaluates on bar close, pivots carry a deliberate confirmation lag, and a cycle drawn three days ago looks exactly as it did when it printed
- Full Direct2D custom rendering: accumulation and distribution zones, sweep highlighting, entry / stop / target lines, right-edge price tags and outcome markers
- The TraderSuite statistics panel, with a ten-cycle form strip and a diagnostics section that counts what the filters rejected and why
- Nine public series so a strategy can read the model the moment it opens, without duplicating any detection logic
- A 26-page user guide covering the engine, every setting, per-market presets, timeframe selection and a recommended workflow
This is an analysis and measurement tool, not an autotrader and not a backtest. It reports what the pattern did on your instrument. What you do with that is your business — and the guide has a section on exactly that.
Related products
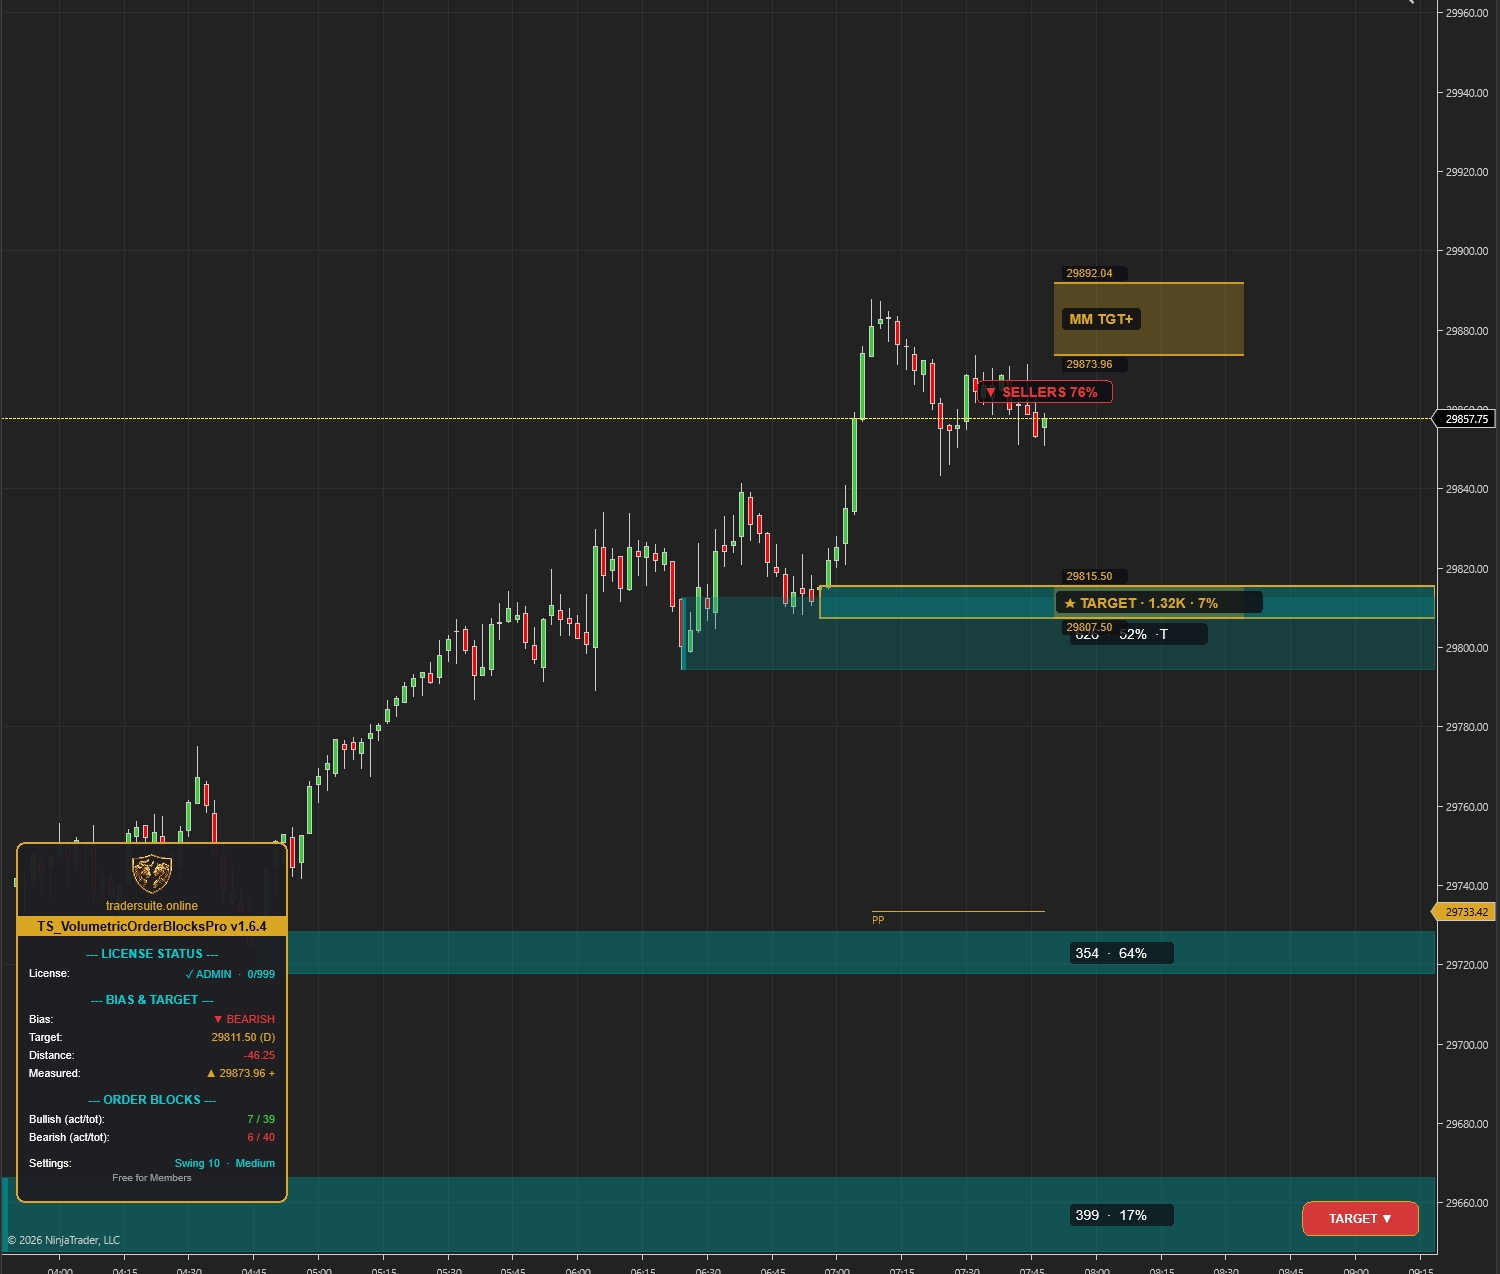
Volumetric Order Blocks Pro
Automatically detect institutional supply & demand zones with volume-weighted order blocks. Identify potential reversal zones where smart money is positioned.
Smartflowpro
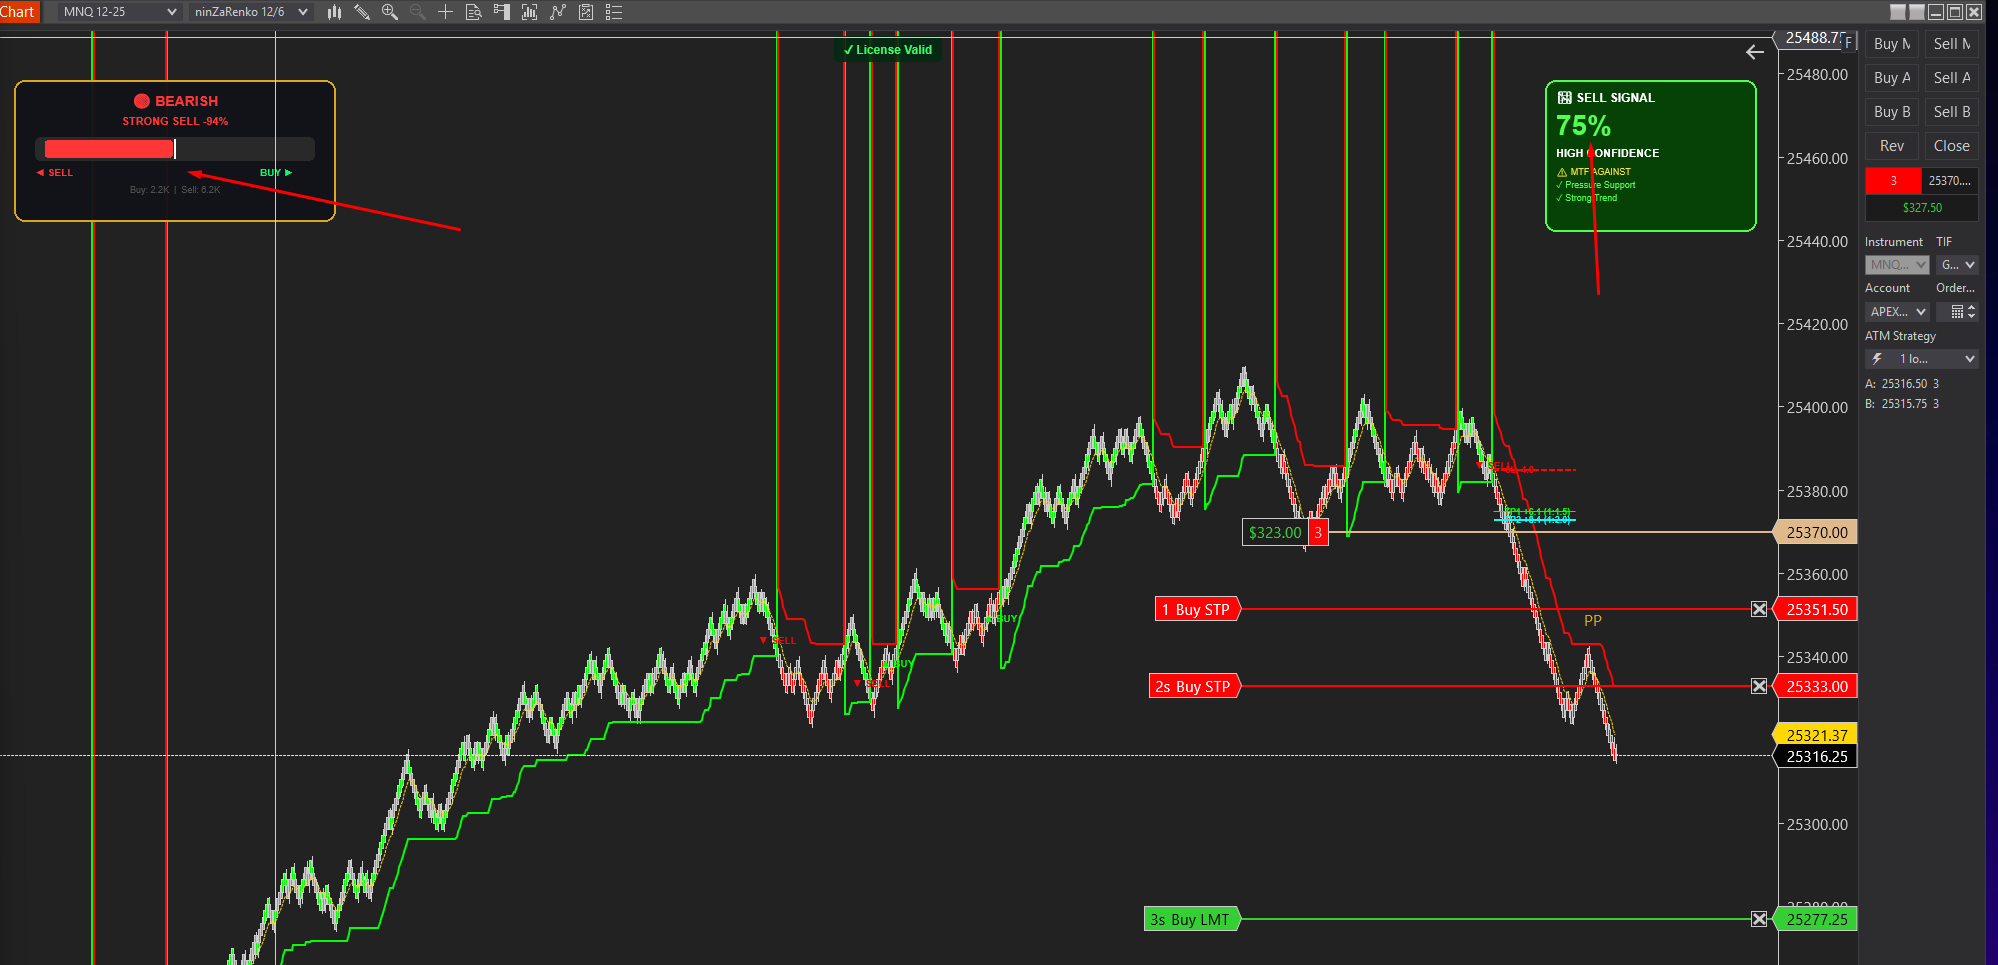
Advanced order flow analysis with real-time Pressure Delta Meter, multi-timeframe confluence scoring, and intelligent signal probability rating. Know who's in control before you trade.
UltraADXVolatilityWaves
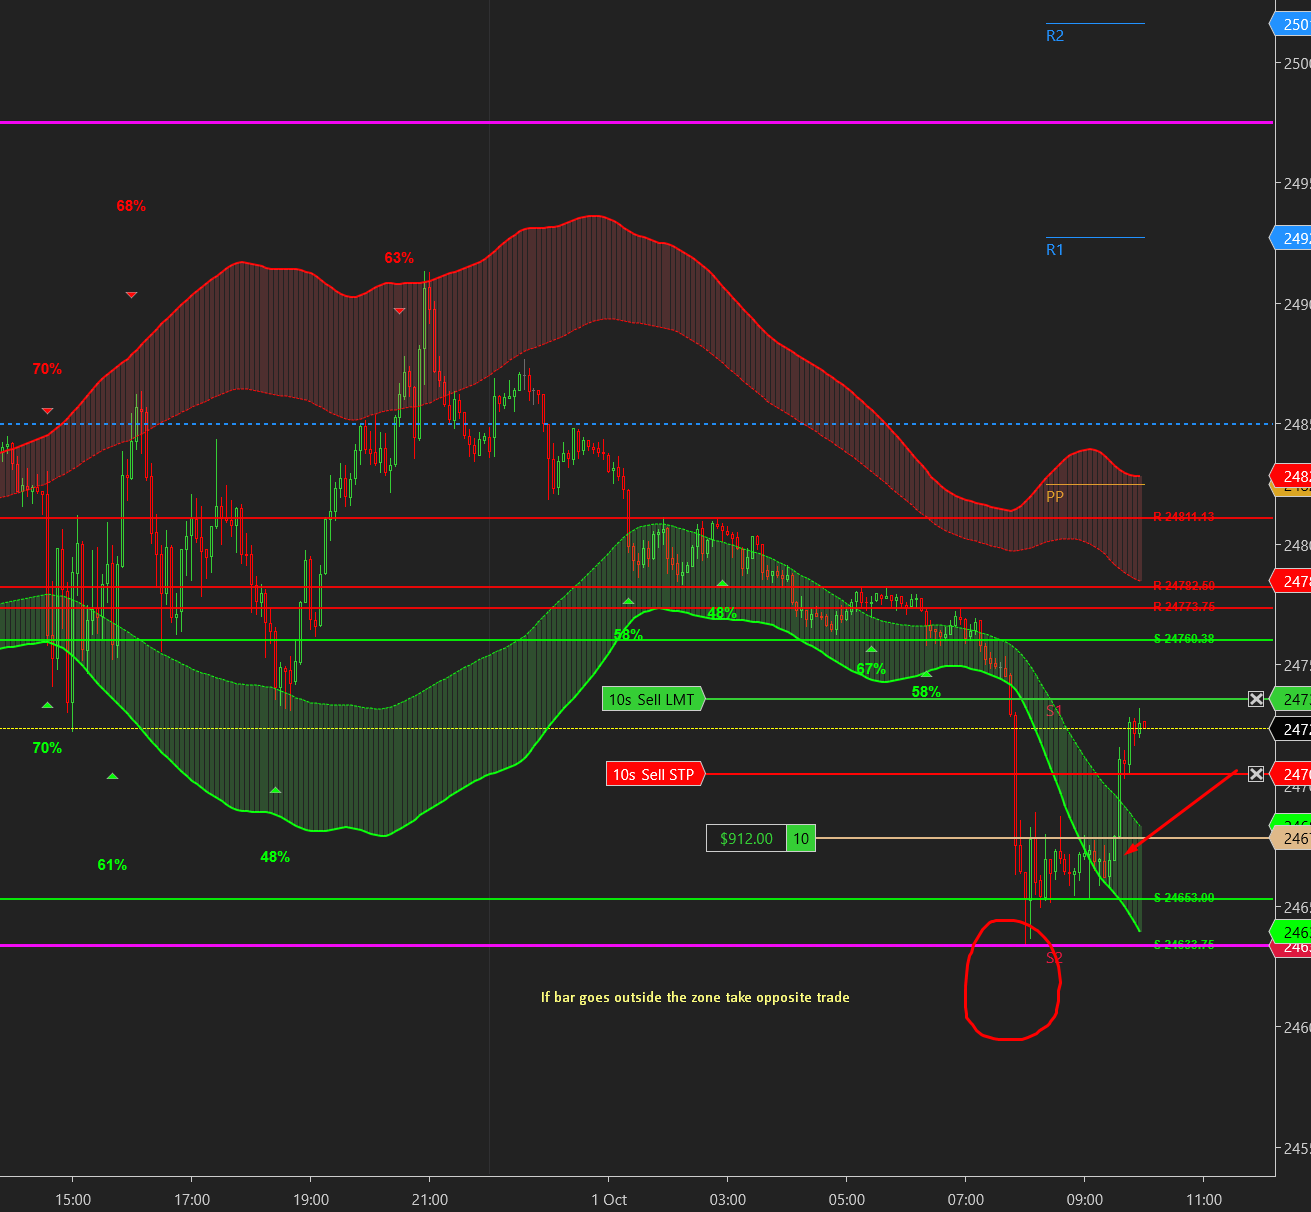
Professional ADX-powered volatility zones indicator with dynamic Support/Resistance, Daily/Weekly levels, ATR-based TP/SL targets, and probability-scored signals. Identify potential reversal zones in real-time.
ICT HTF Candles Pro
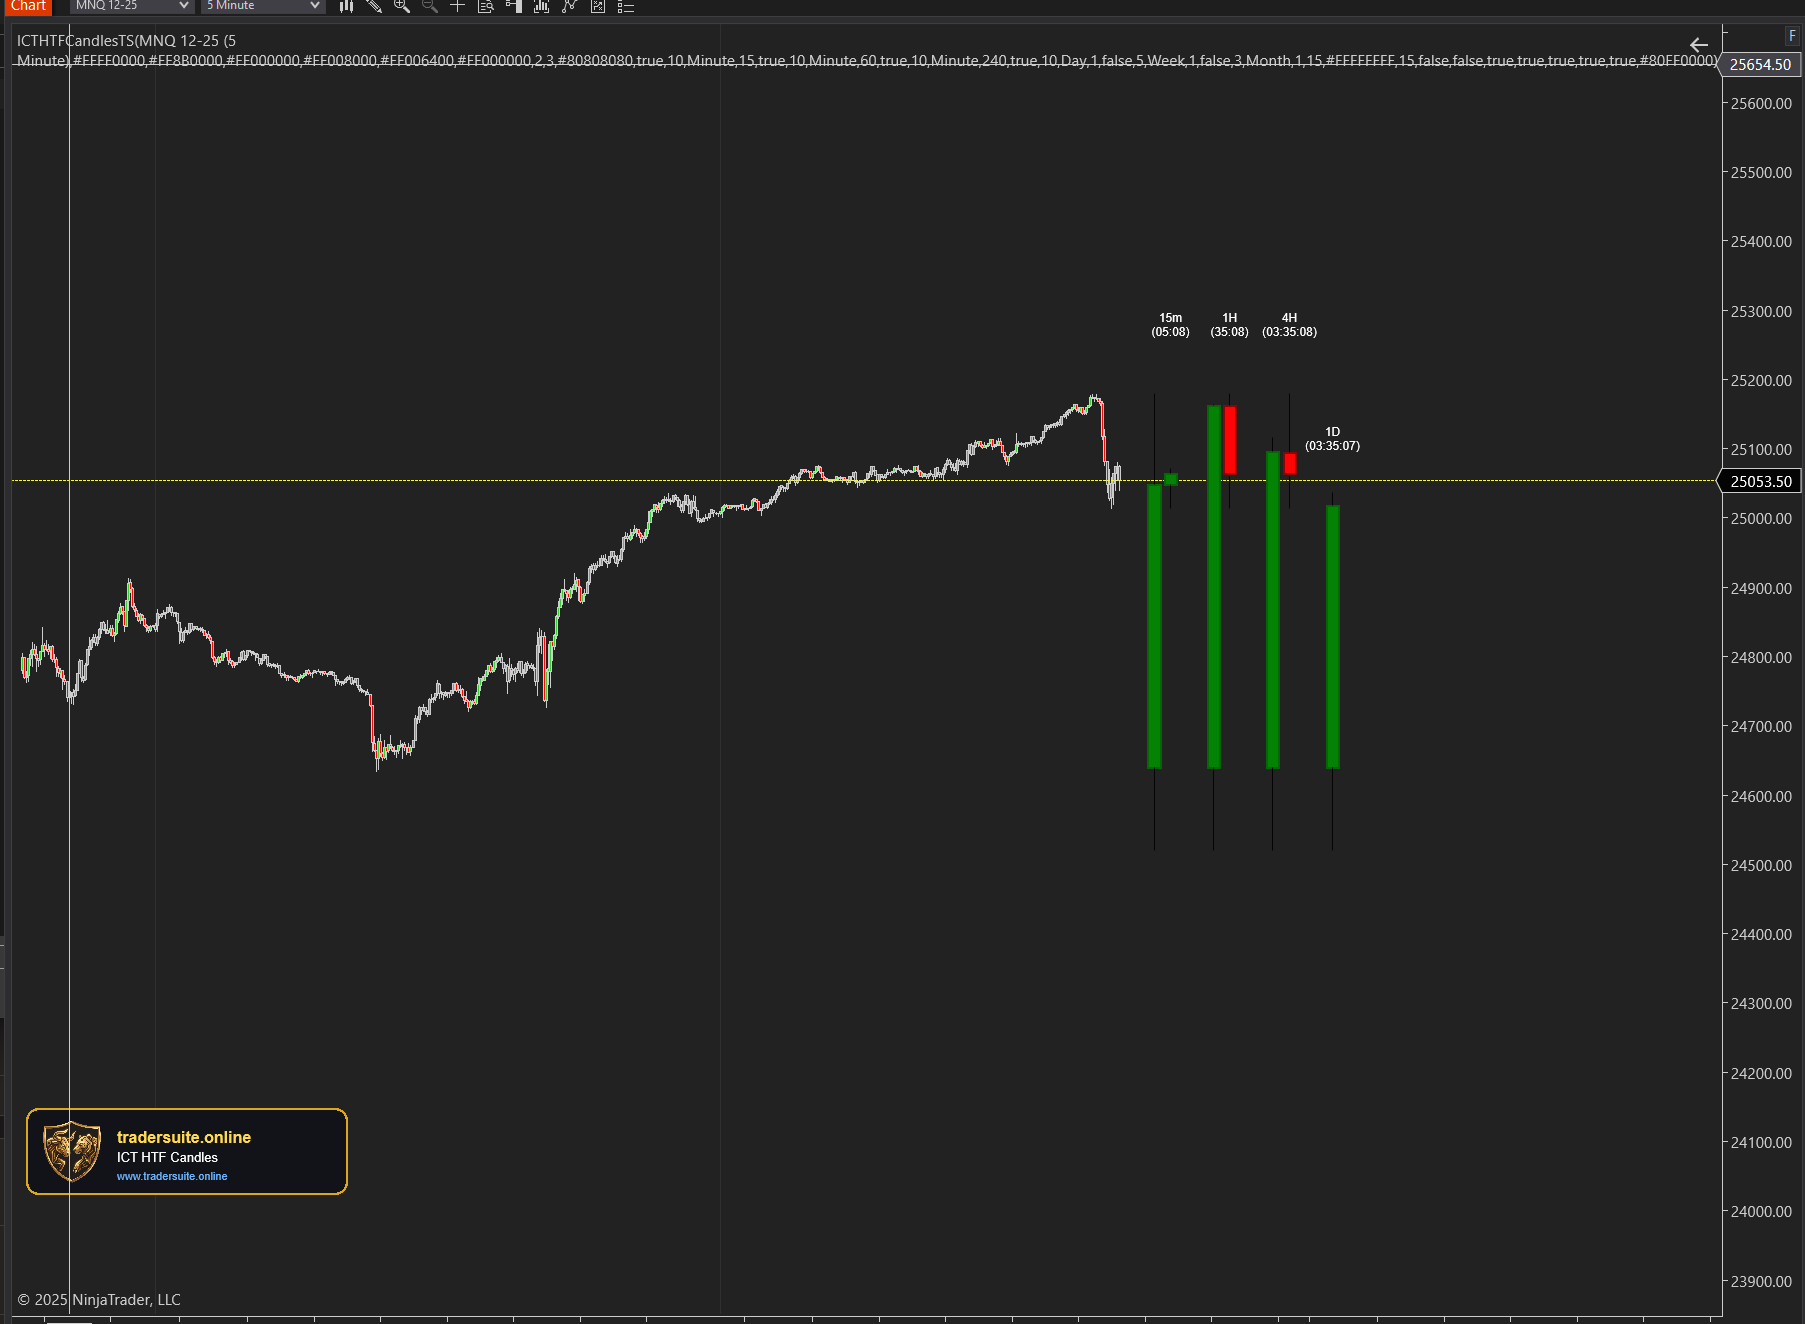
Visualize multiple higher timeframe candles directly on your chart with real-time countdown timers, Fair Value Gap detection, and Volume Imbalance highlighting. Perfect for ICT traders who need multi-timeframe confluence without switching charts.