TS Reversal Ribbon – Trend Reversal Indicator
NinjaTrader 8 trend reversal indicator: 10-line MA ribbon, reversal %, REV signals filtered by the 200 MA, BUY/SELL entries with stop and target.
Descarga segura
Acceso inmediato
Actualizaciones de por vida
Gratis para siempre
2 activaciones
Por licencia
Documentación
Descargar guía de usuario
Catch the turn — not the top. On NinjaTrader 8.
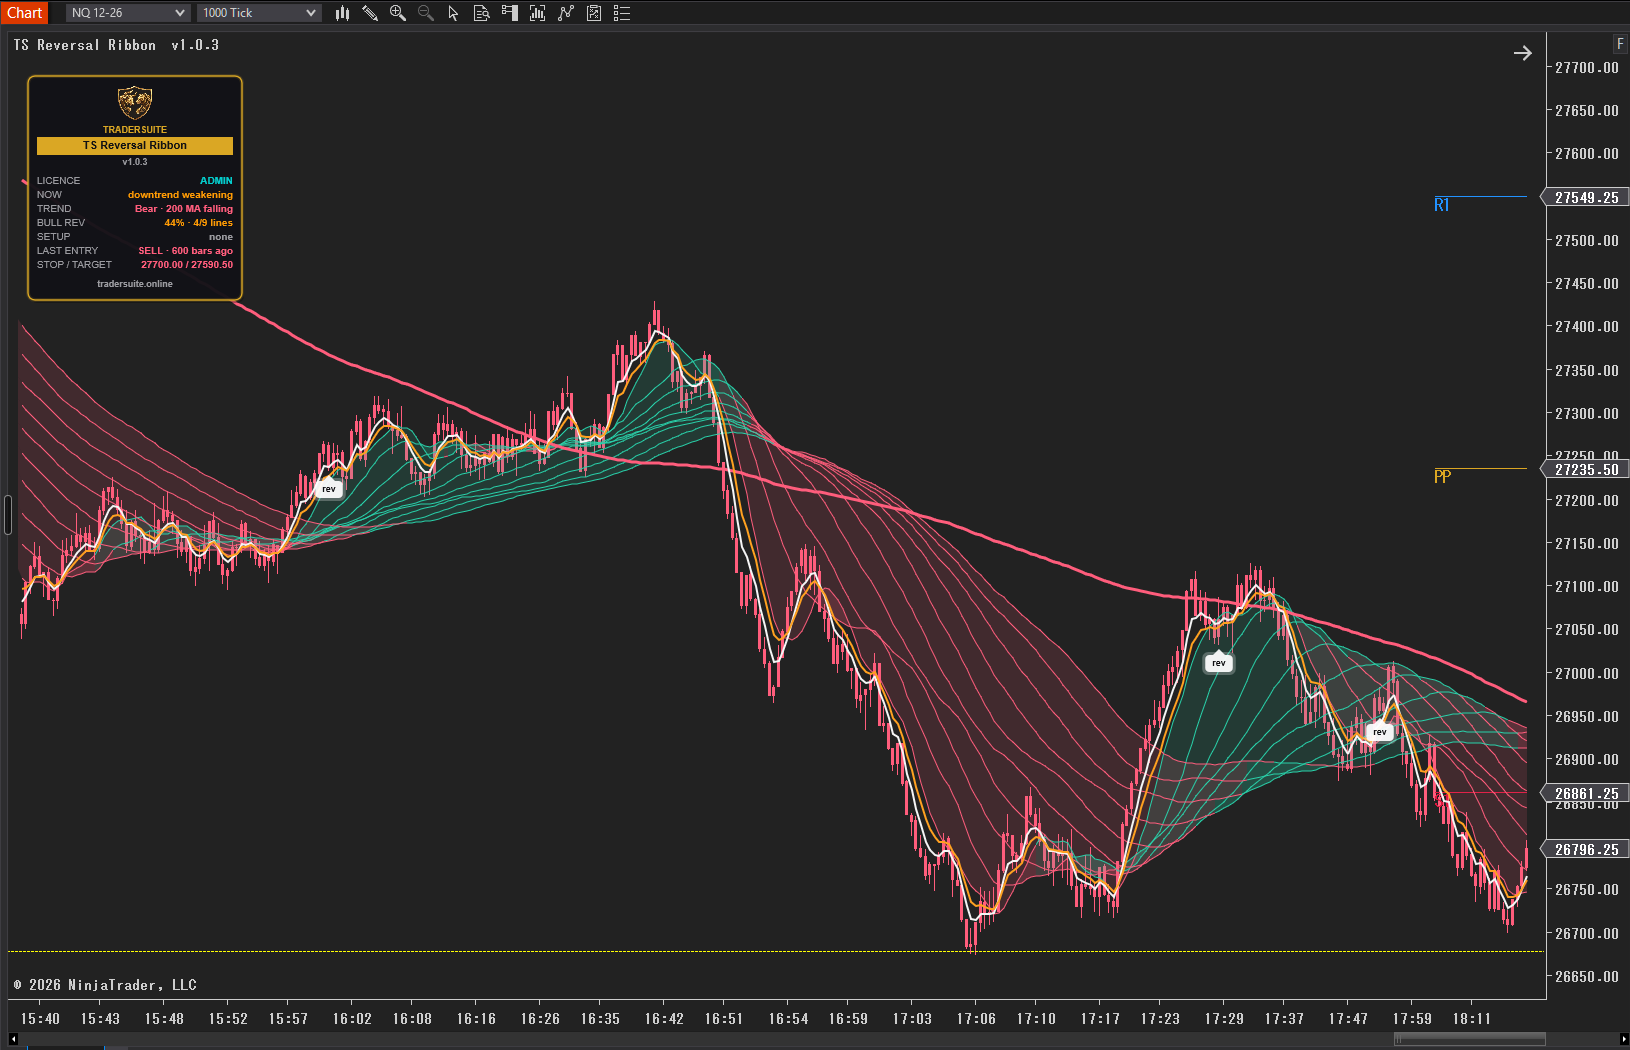
Most traders try to guess where a trend ends. TS Reversal Ribbon waits until the turn has really started. Ten moving averages form a ribbon: when a trend begins to turn, the fast lines turn first and the slow ones follow. The indicator measures how much of the ribbon has already turned against the trend, prints a reversal signal when most of it has, and then marks a confirmed entry with the stop and target drawn for you.
How it works
- The ribbon — 10 moving averages (10 to 100 bars), each line and band coloured by its own slope: teal rising, rose falling.
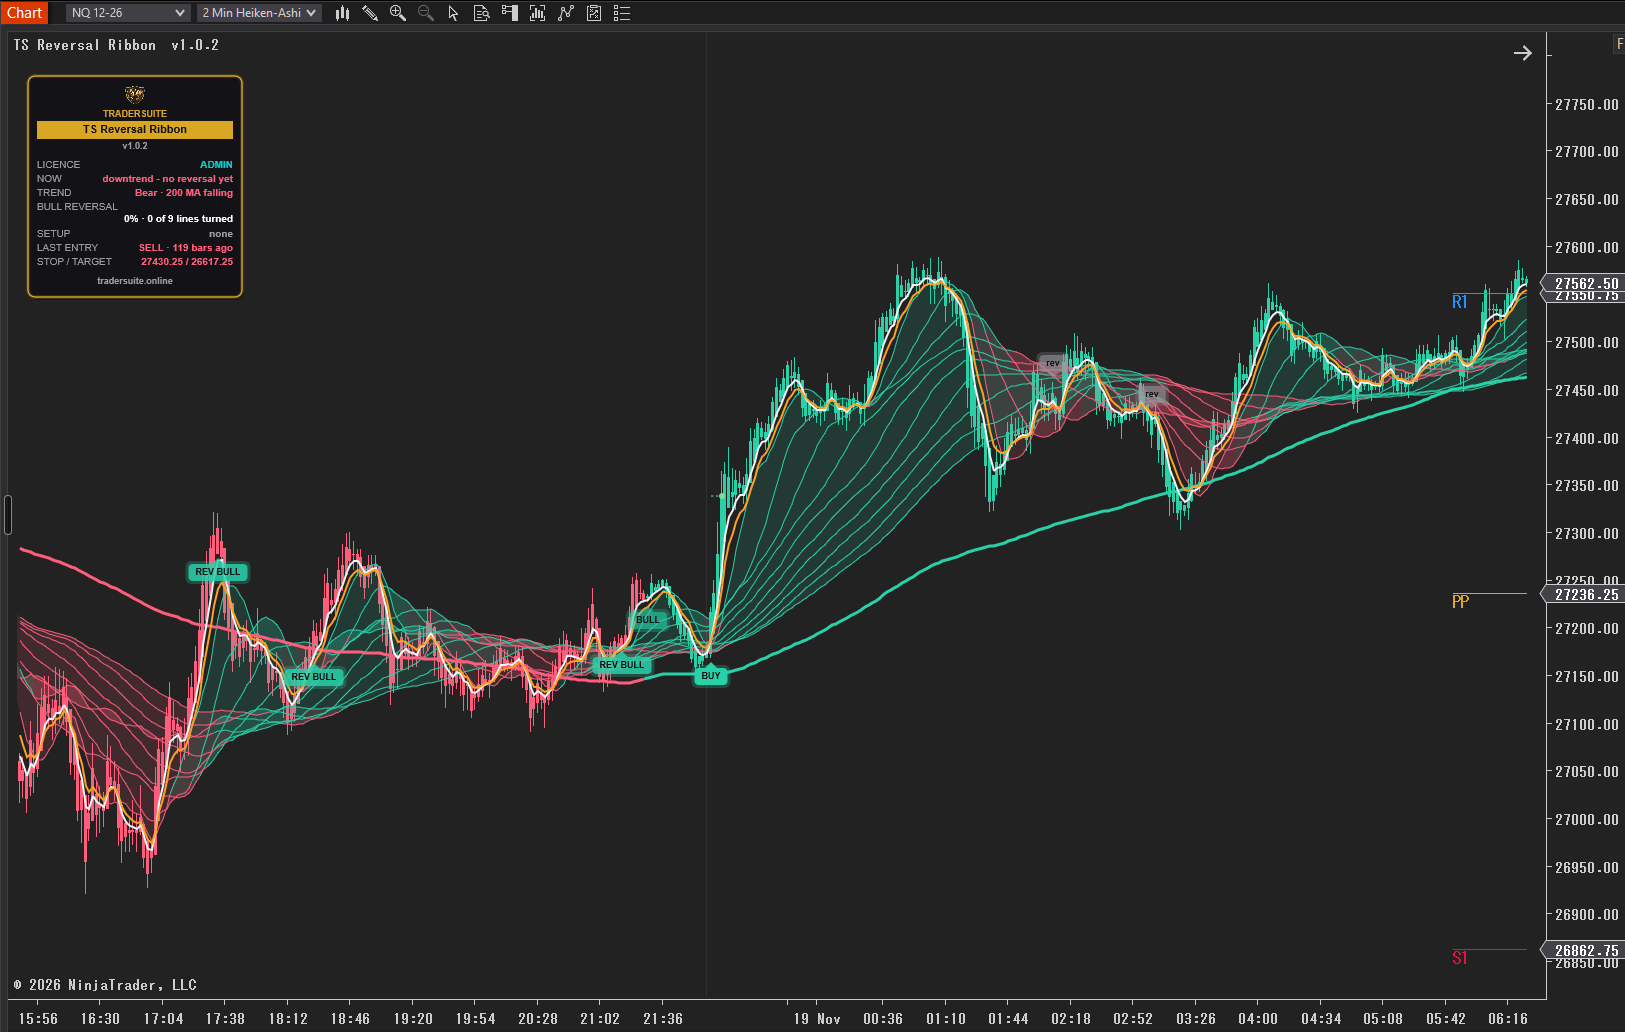
- The trend line — a thick 200 MA. Its slope is the trend; BULL / BEAR labels mark when it turns.
- REVERSAL % — the share of the ribbon already sloping against the trend, shown live in the panel.
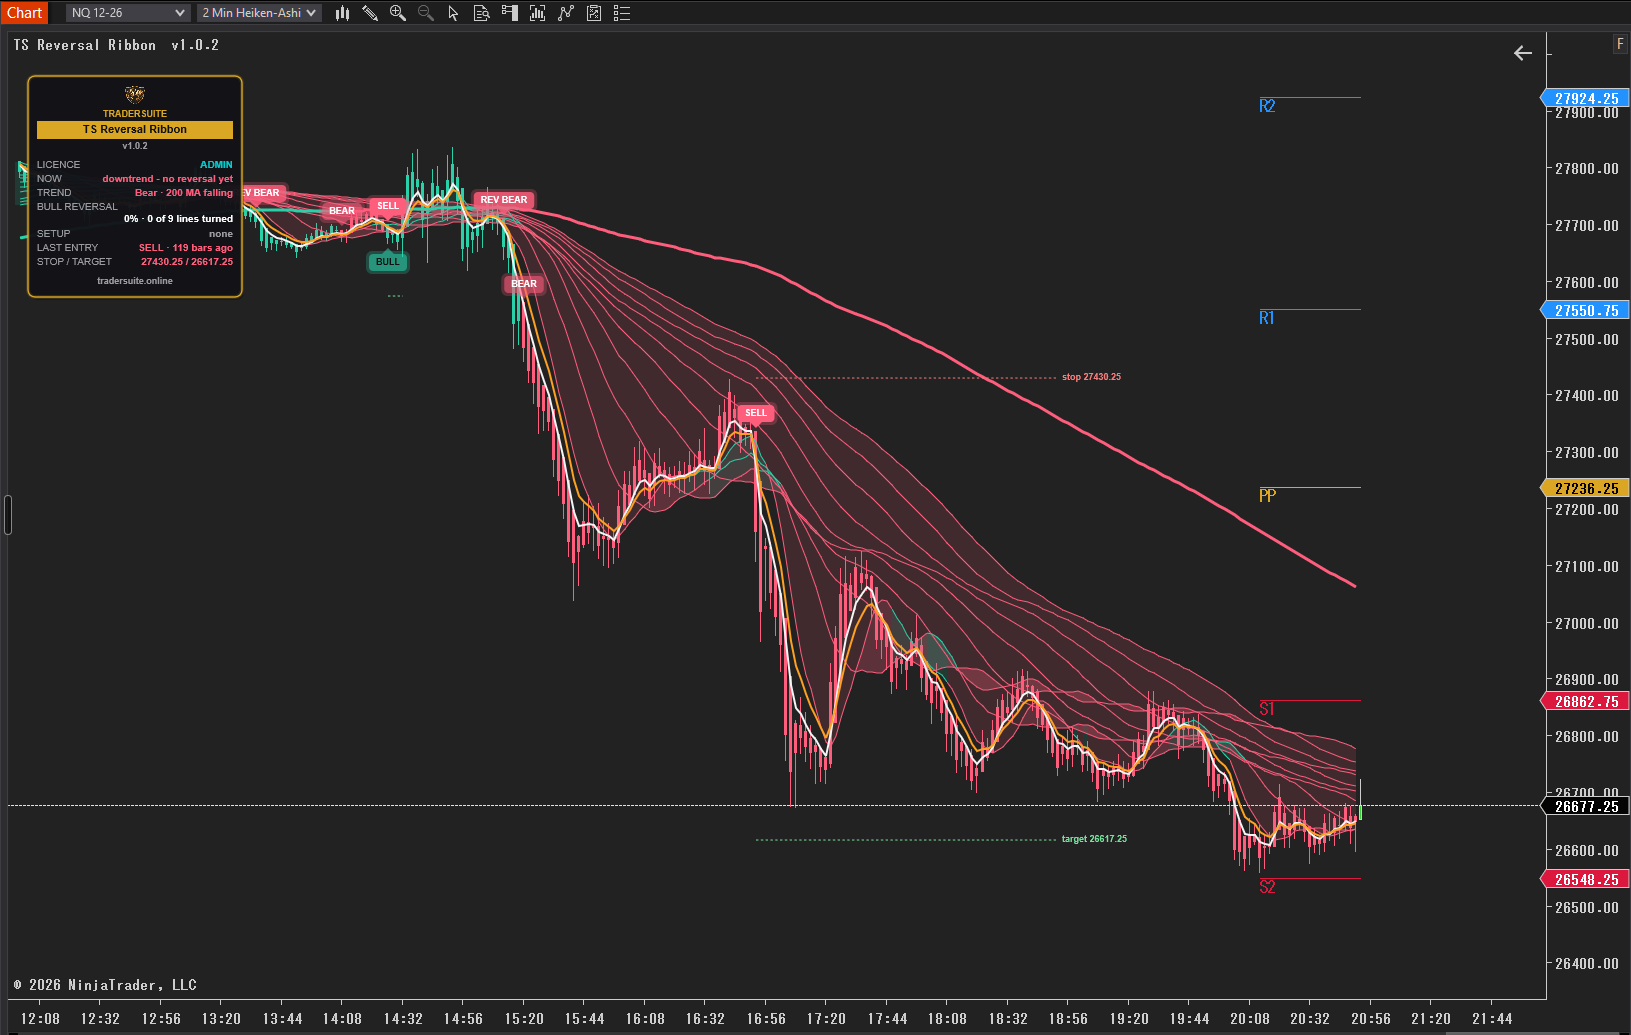
- REV BULL / REV BEAR — printed when most of the ribbon has turned. A reversal only counts once price is on the right side of the 200 MA; on the wrong side it shows as a white “rev” and is ignored.
- BUY / SELL — after an accepted reversal, the indicator waits for the pullback on a fast and a slow EMA, and signals when the fast line crosses back.
- Trade map — entry, a stop beyond the recent swing or the 200 MA (whichever is nearer) and a target at three times the risk, drawn on the chart.
Honest by design
Every decision is taken when a bar closes. A label never moves or disappears afterwards — no repainting. Set-ups that are cancelled are simply never traded, and losing trades are drawn as plainly as winners: the trade map ends with a red dot on the stop.
What you get
- 10-line moving-average ribbon and 200 MA trend line, coloured by slope
- REVERSAL % reading and REV BULL / REV BEAR signals with the 200 MA filter
- BUY / SELL entries on the EMA pullback-and-cross
- Trade map: entry, stop and a 3R target (adjustable), on the tick grid
- BULL / BEAR trend-flip labels; labels never overlap
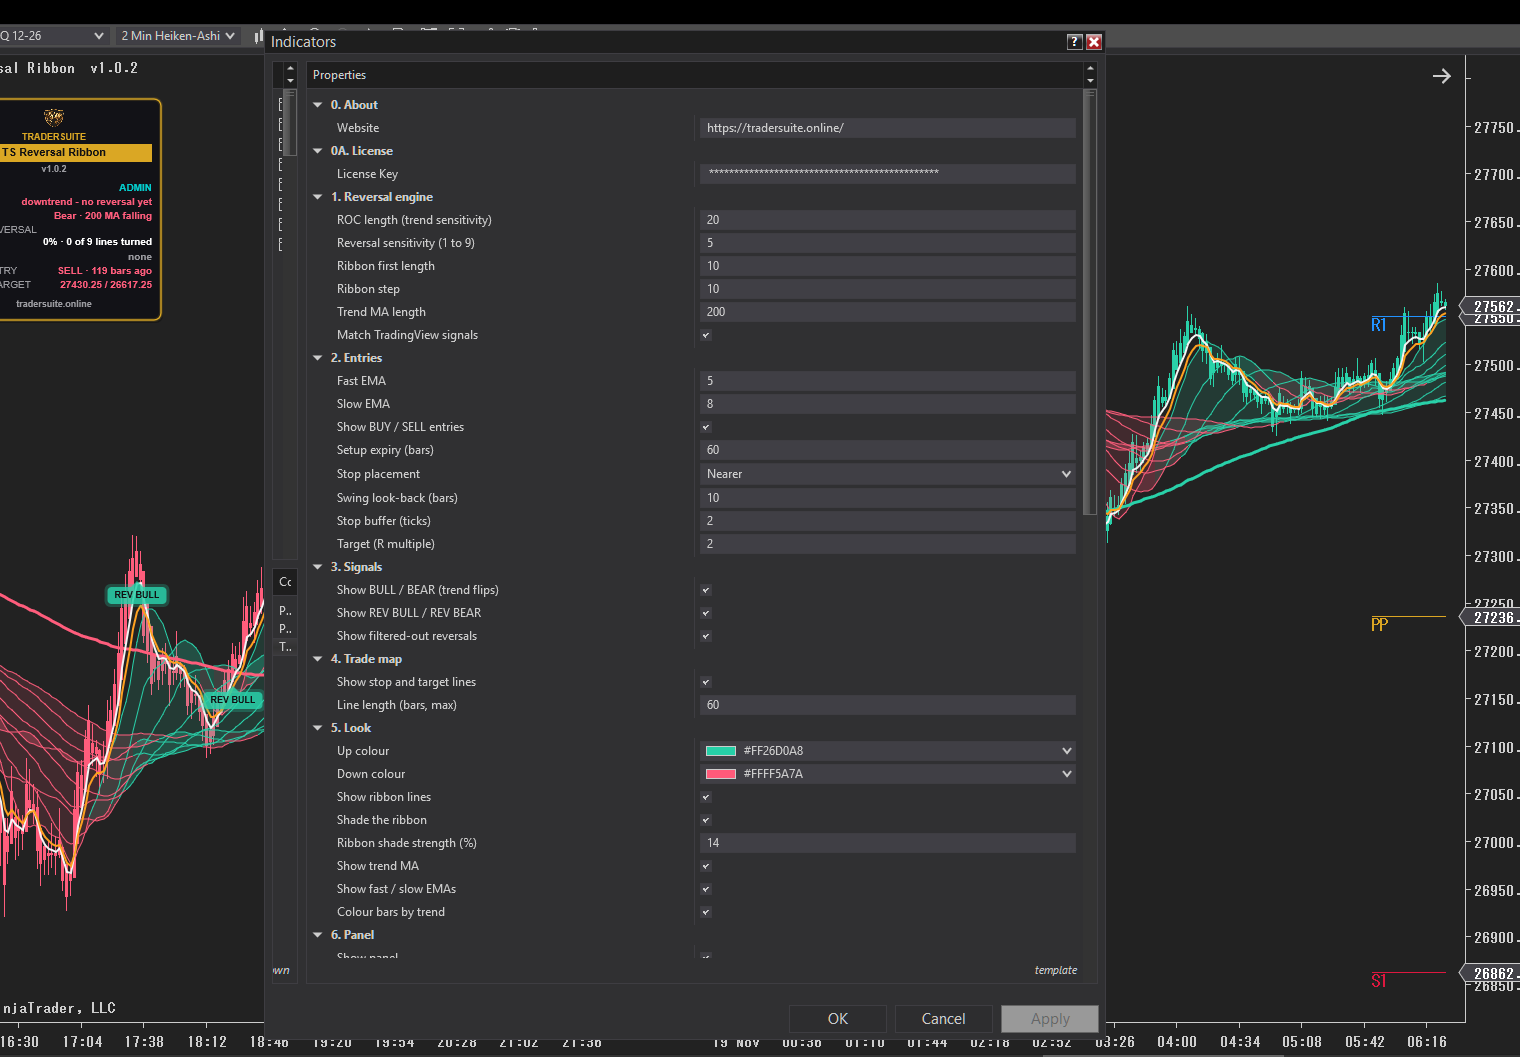
- Plain-English panel (compact or normal size): what now, trend, reversal %, set-up, last entry, stop and target
- Opacity settings for the ribbon lines, the shading and the trend line; bar colouring by trend
- Real-time alerts on entries, reversals and trend flips, with your own sound
- Outputs for NinjaScript strategies and the Market Analyzer
- 33-page illustrated PDF user guide with the A-grade trading checklist and risk sizing
- Lifetime updates, included in Pro Membership
Questions traders ask
Does it repaint?
No. Every label is decided on a closed bar and never changes.
Is the REVERSAL % a probability?
No. It is the share of the ribbon lines that have already turned against the trend — a measurement of how far a turn has spread, not a forecast.
Which timeframes?
It runs on any time-based chart. The user guide recommends 5 to 15-minute charts and explains why.
Which markets?
Index futures (ES, NQ, YM, RTY), Gold and Crude, and their micros.
Does it place trades?
No. It draws signals and a trade map. You decide and you place the orders.
Is it included in Pro Membership?
Yes. Pro Members unlock it with their membership key.
Please note: TS Reversal Ribbon is a decision-support tool — it does not predict price and places no orders. Trading futures involves substantial risk of loss. Educational tool, not financial advice.
Demo del producto
Productos relacionados
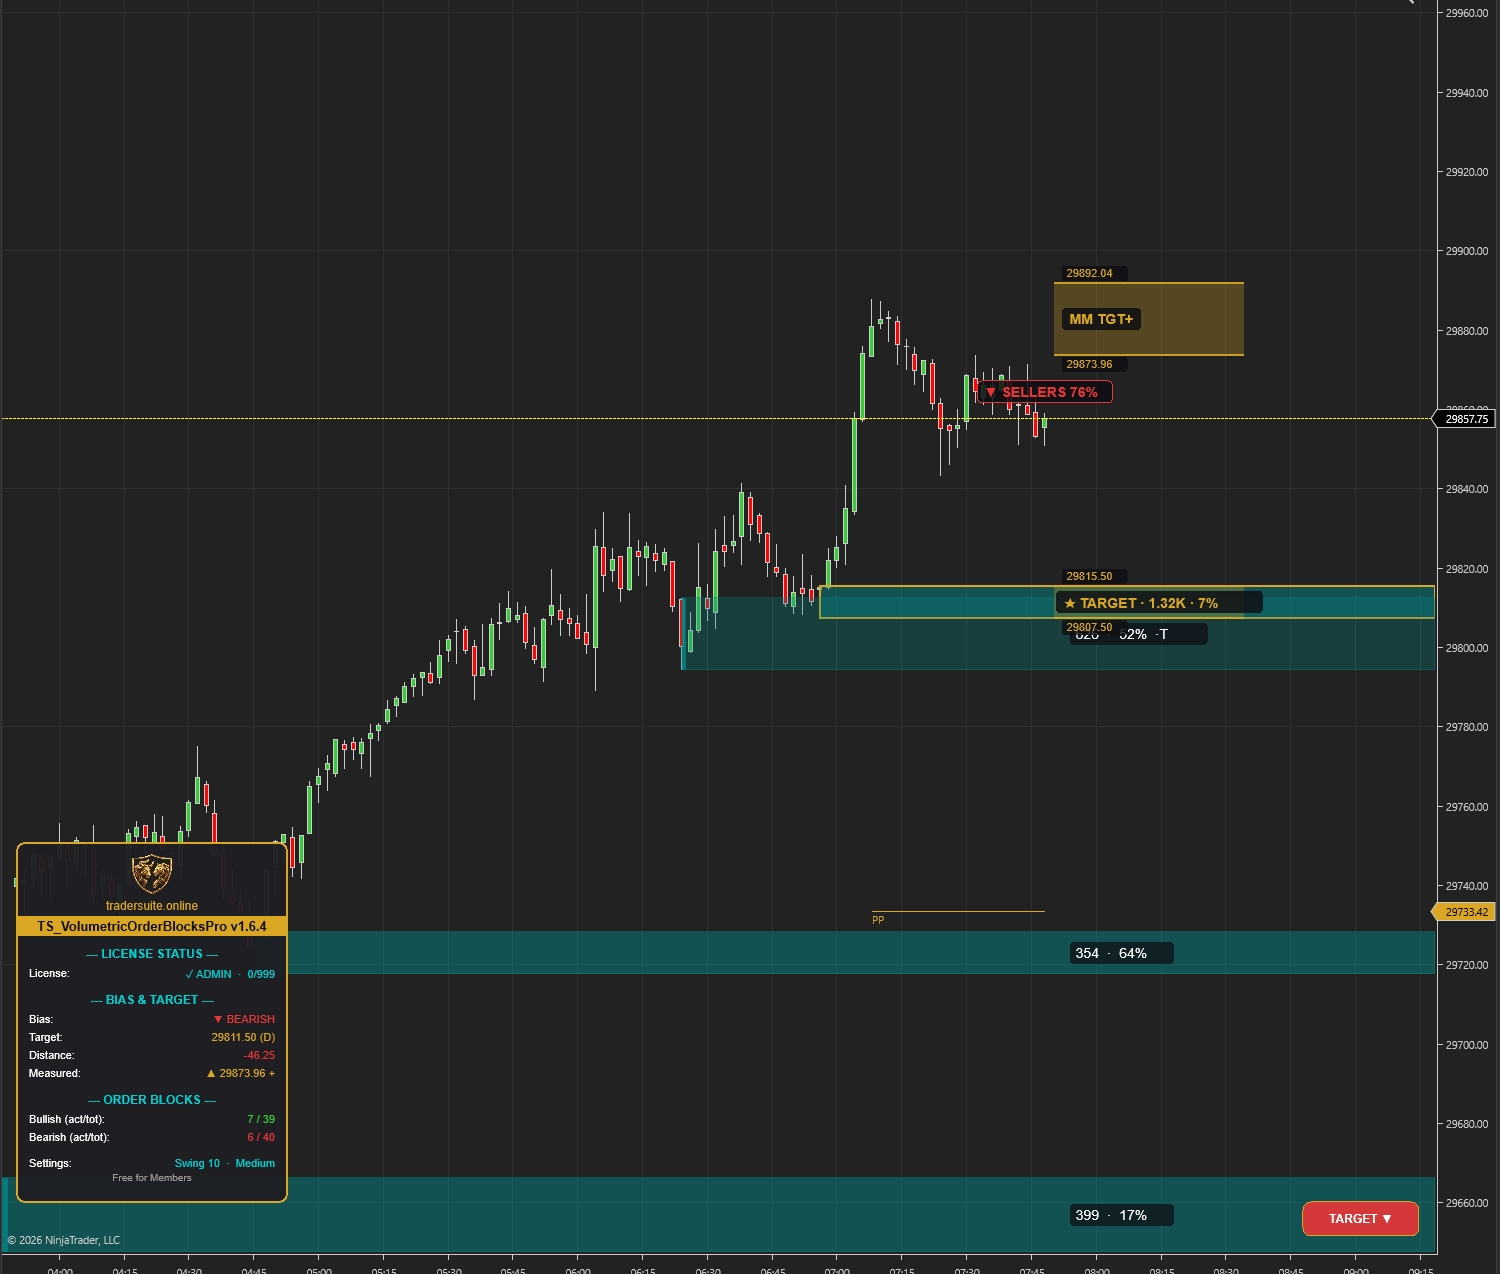
Volumetric Order Blocks Pro
Detecta automáticamente zonas institucionales de oferta y demanda con order blocks ponderados por volumen. Identifica posibles zonas de giro donde está posicionado el smart money.
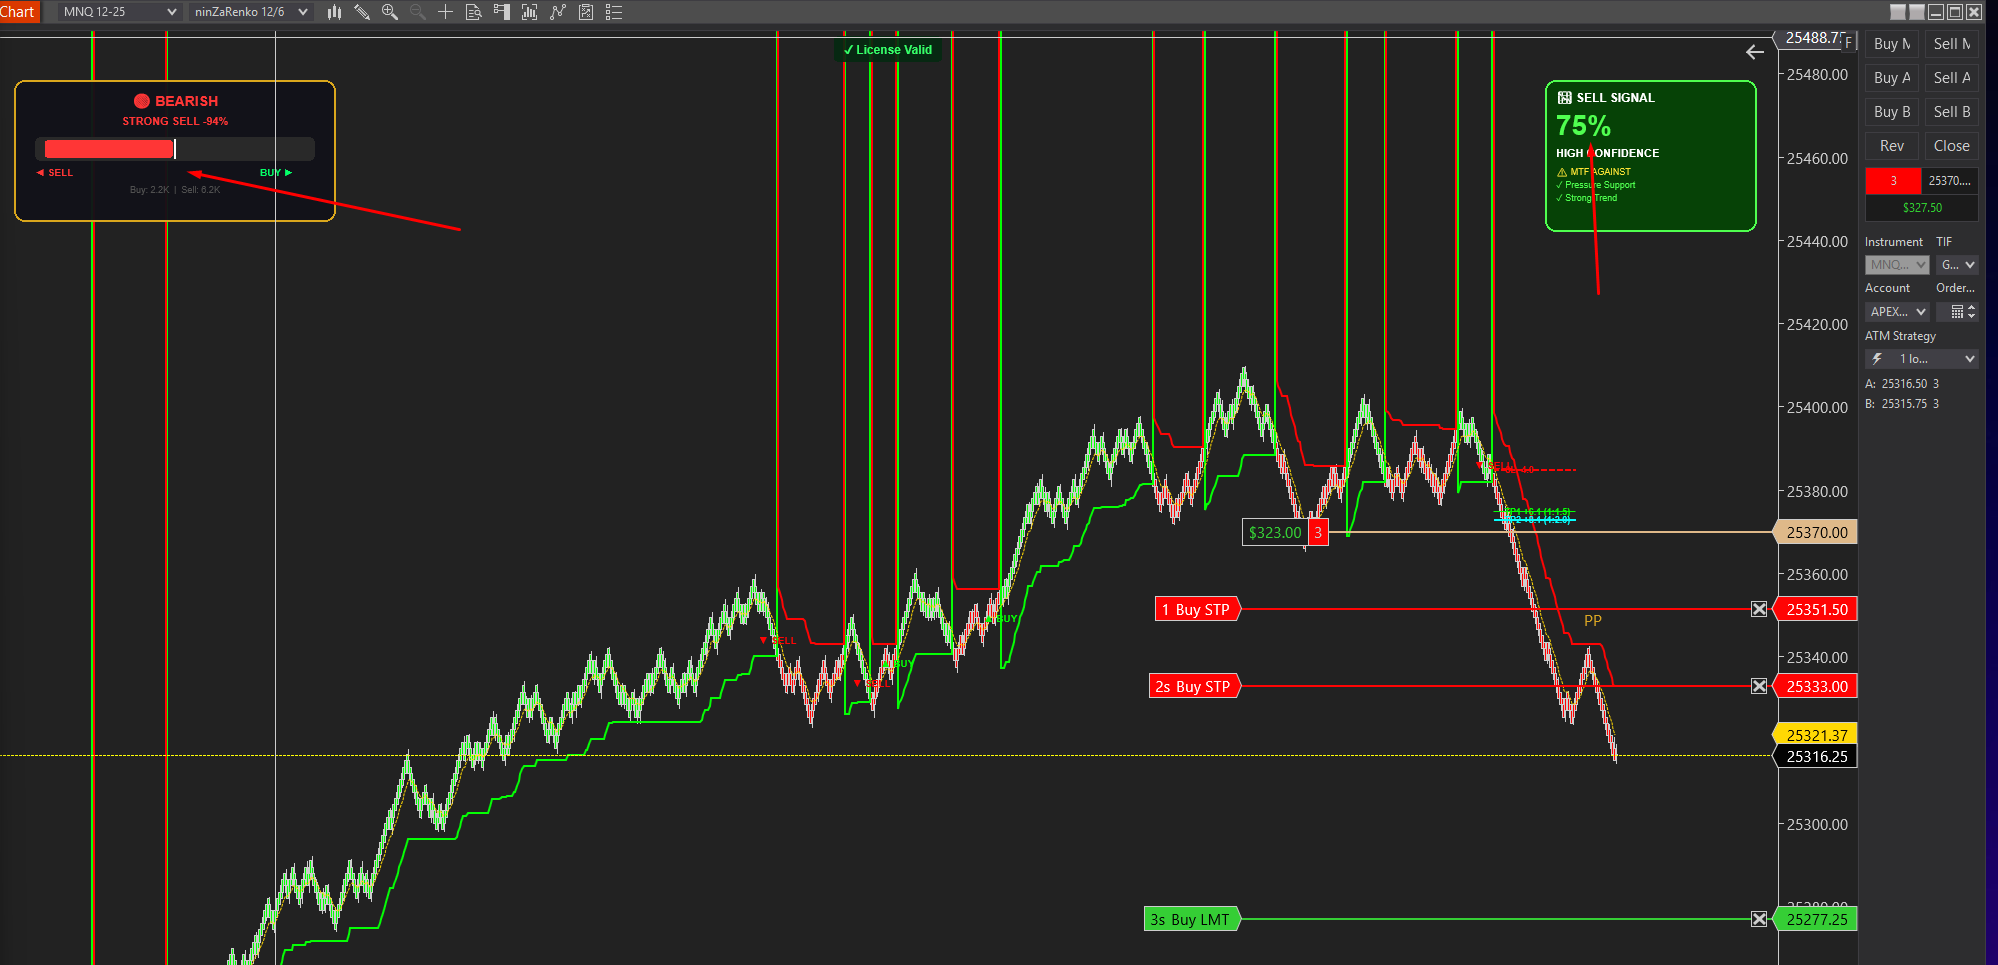
Smartflowpro
Análisis avanzado de order flow con Pressure Delta Meter en tiempo real, puntuación de confluencia multi-timeframe y valoración inteligente de la probabilidad de la señal. Mira quién tiene el control antes de operar.
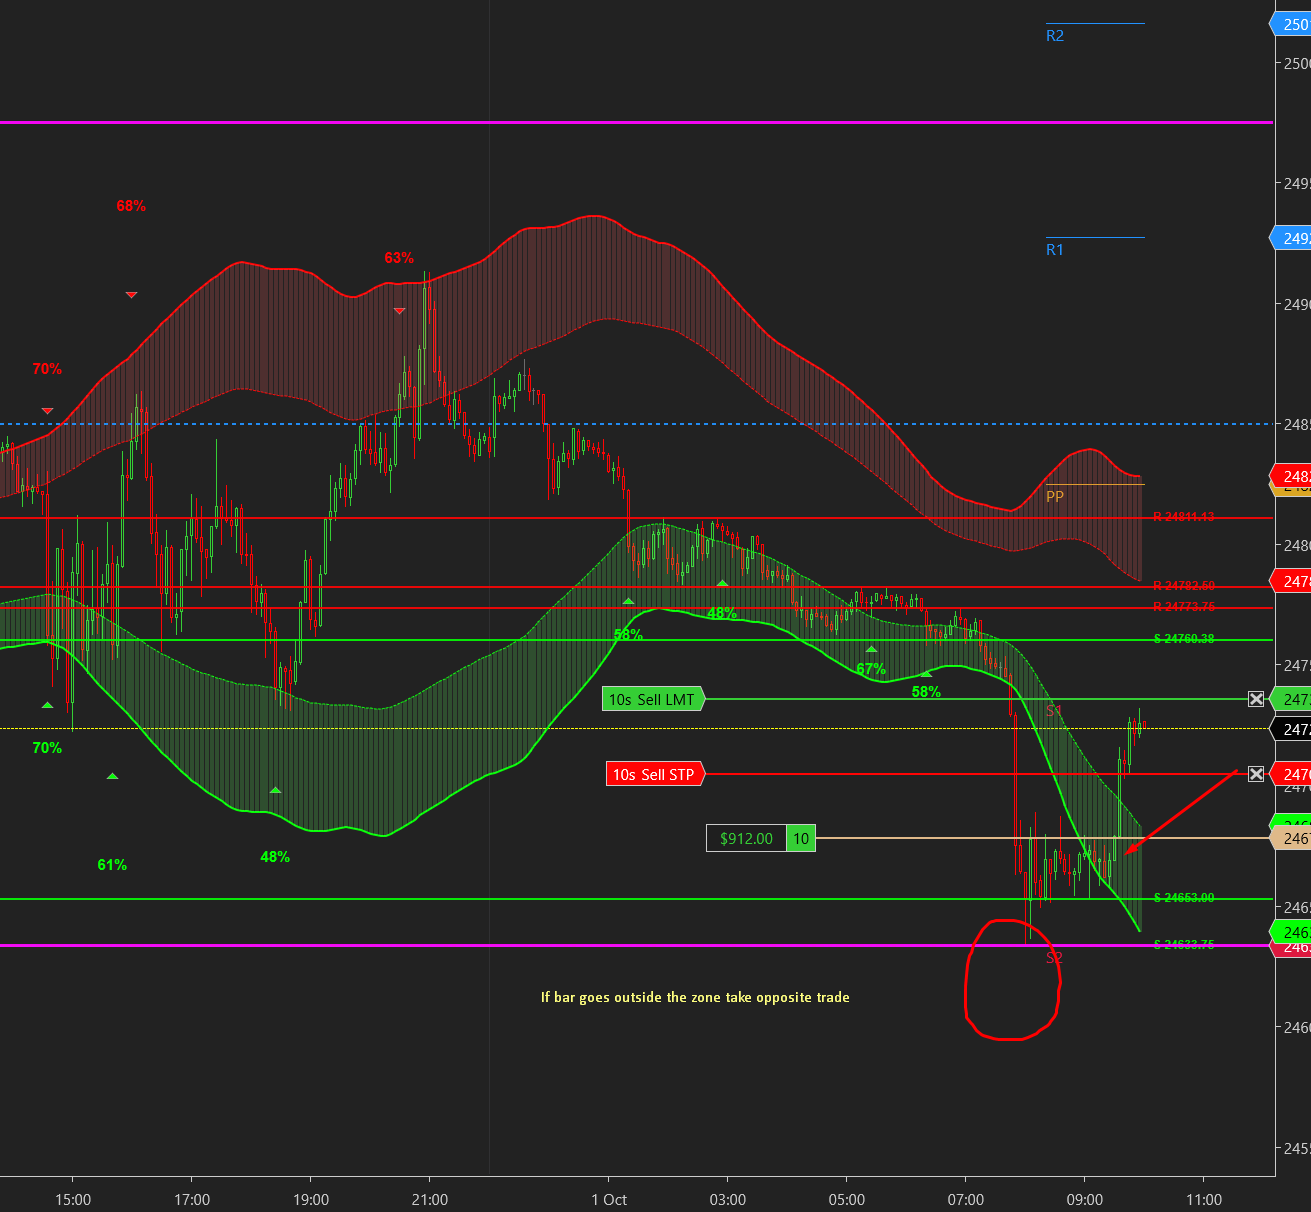
UltraADXVolatilityWaves
Indicador profesional de zonas de volatilidad basado en ADX, con soportes/resistencias dinámicos, niveles diarios/semanales, objetivos TP/SL basados en ATR y señales con puntuación de probabilidad. Identifica posibles zonas de reversión en tiempo real.
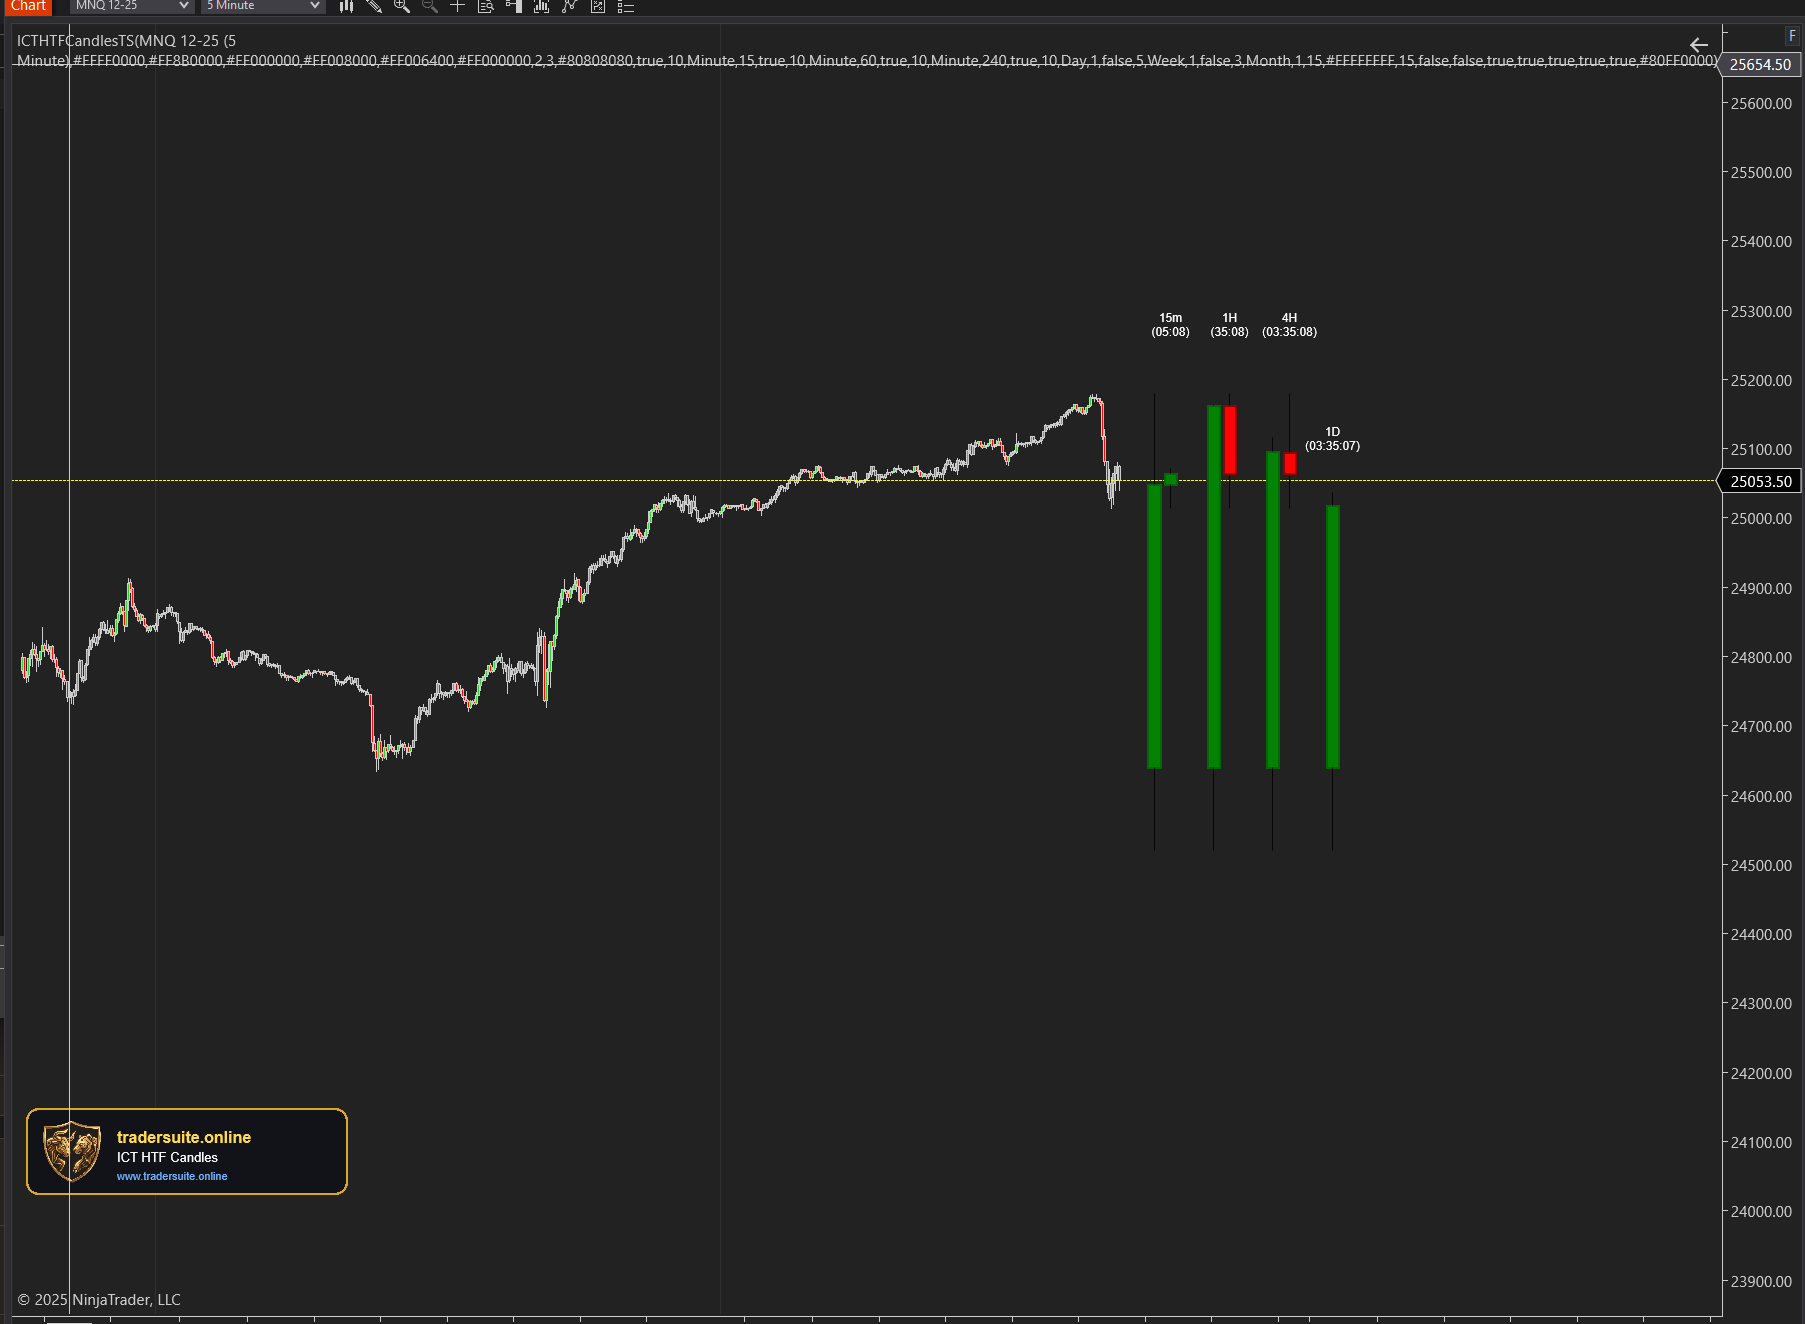
ICT HTF Candles Pro
Visualiza varias velas de temporalidad mayor directamente en tu gráfico, con temporizadores de cuenta regresiva en tiempo real, detección de Fair Value Gaps y resaltado de Volume Imbalances. Ideal para traders ICT que necesitan confluencia multi-temporalidad sin cambiar de gráfico.