TS IV Compass – Expected Move & Implied Volatility
The options market's expected move for today, drawn as bands on your NQ and ES chart. Day type (quiet, normal or wild), a range-used gauge, and the fear readings: IV, skew, term and IV rank.
Descarga segura
Acceso inmediato
Actualizaciones de por vida
Gratis para siempre
2 activaciones
Por licencia
Documentación
Descargar guía de usuario
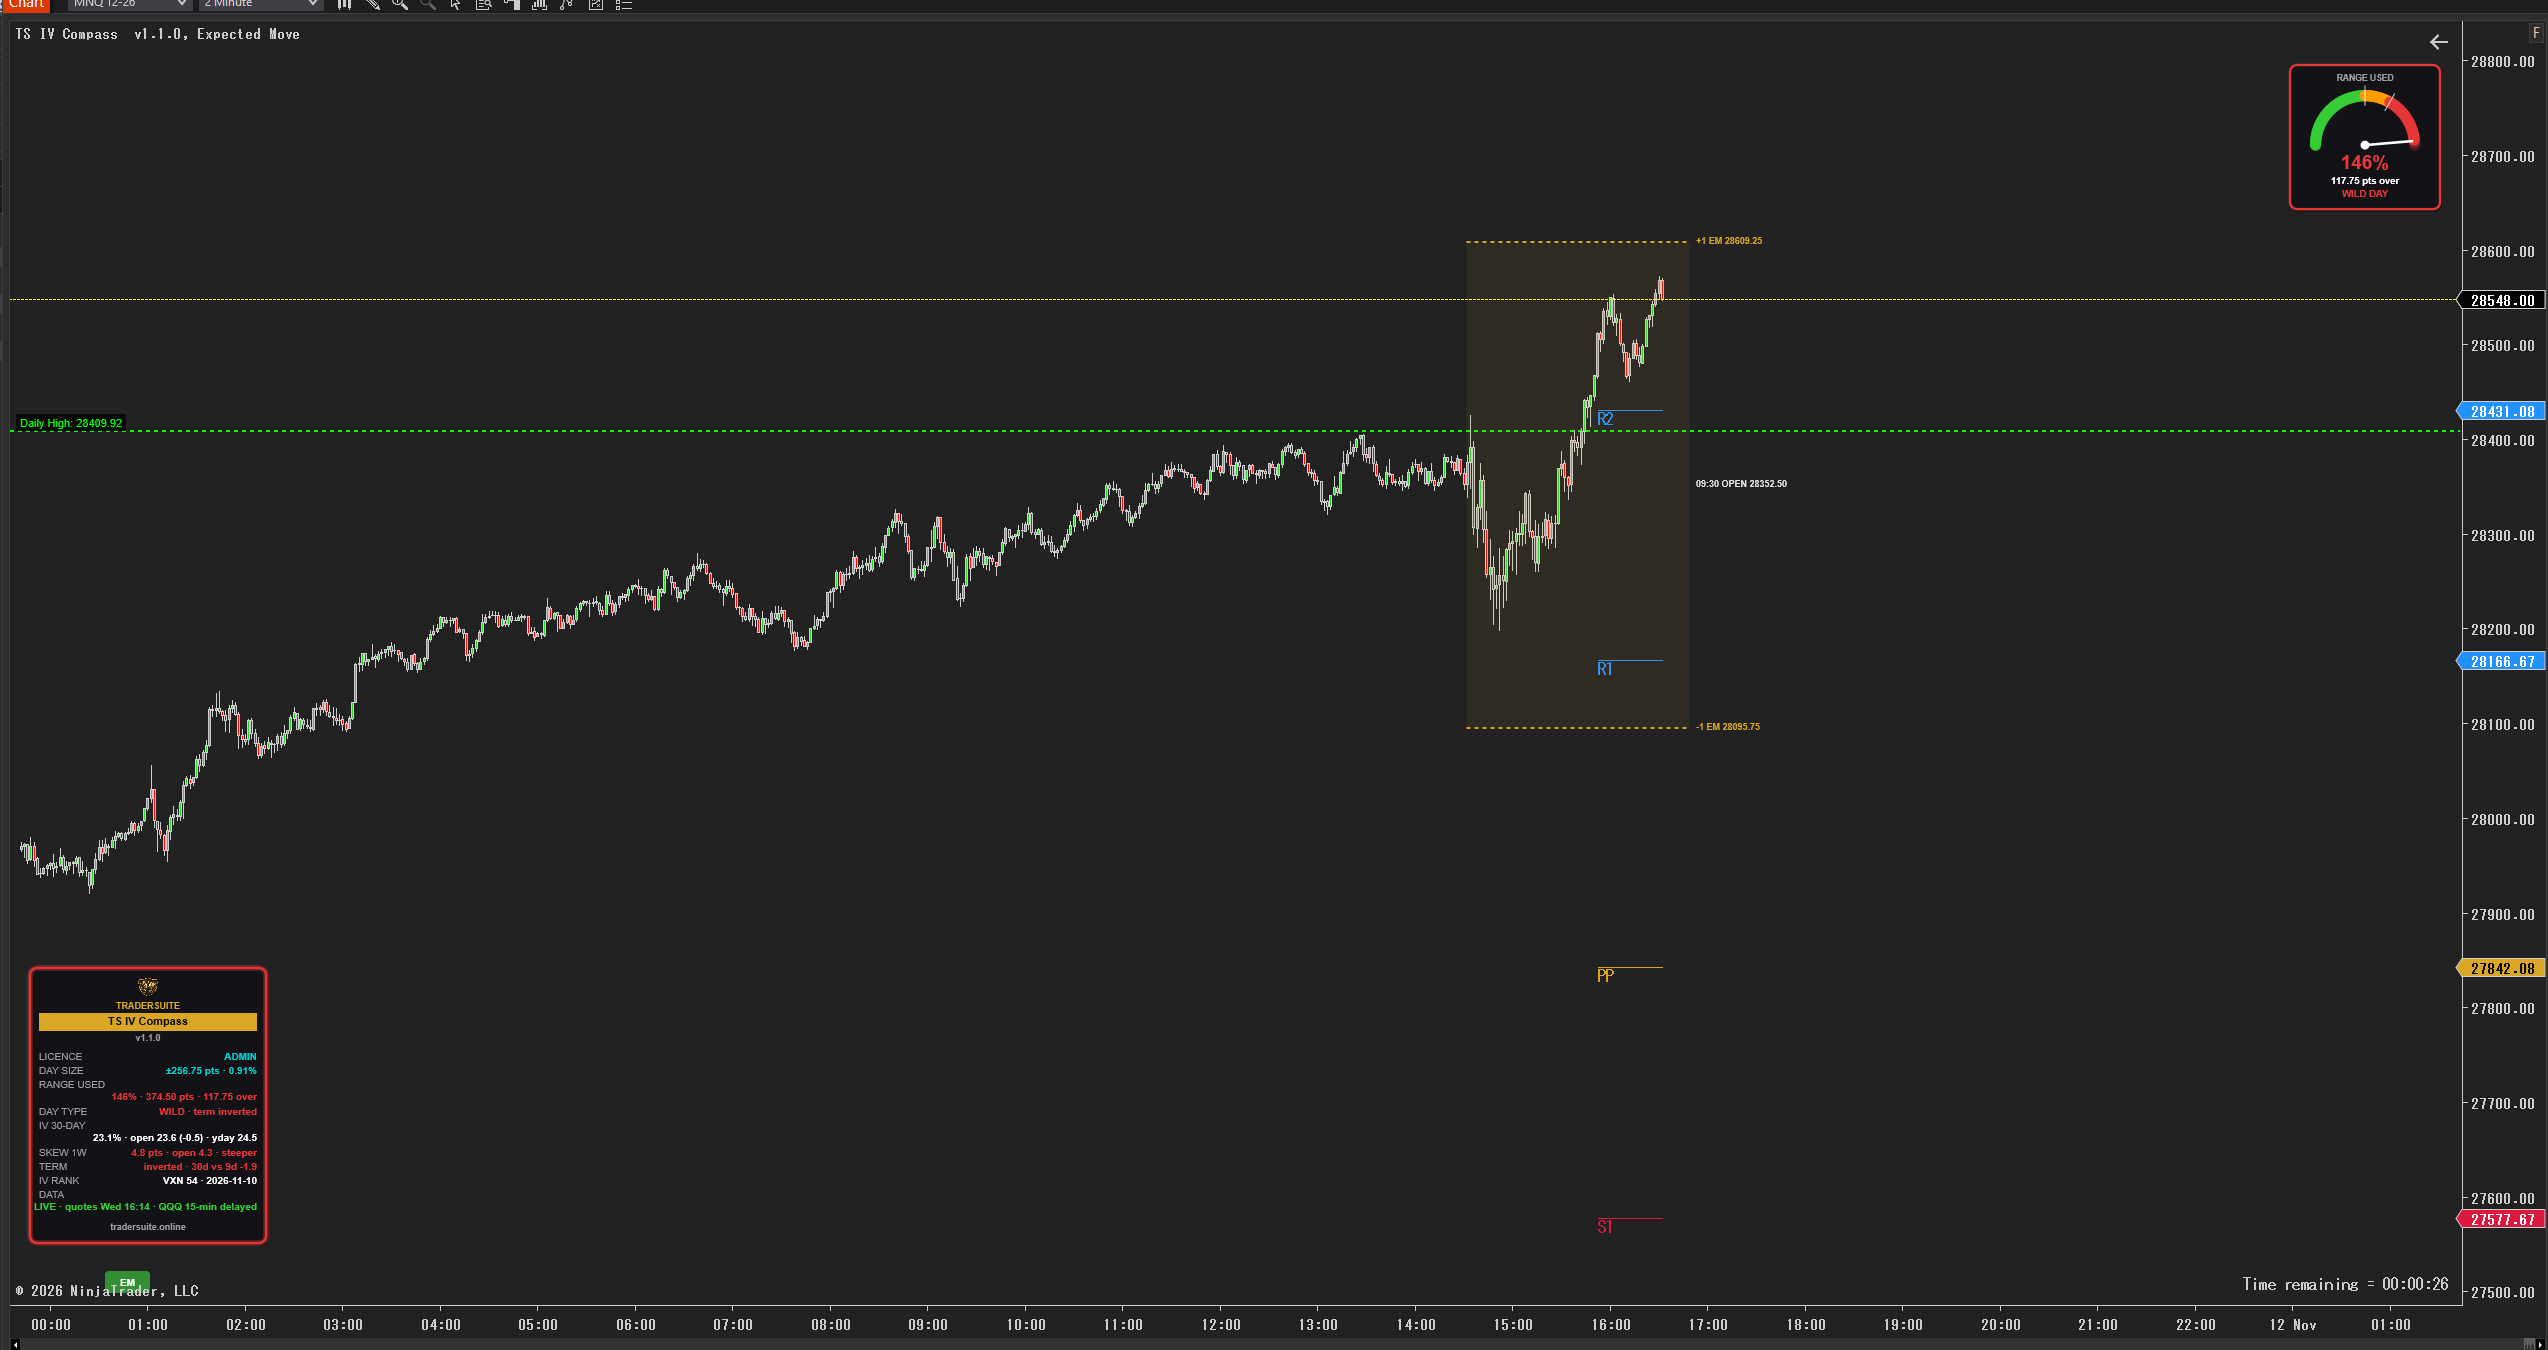
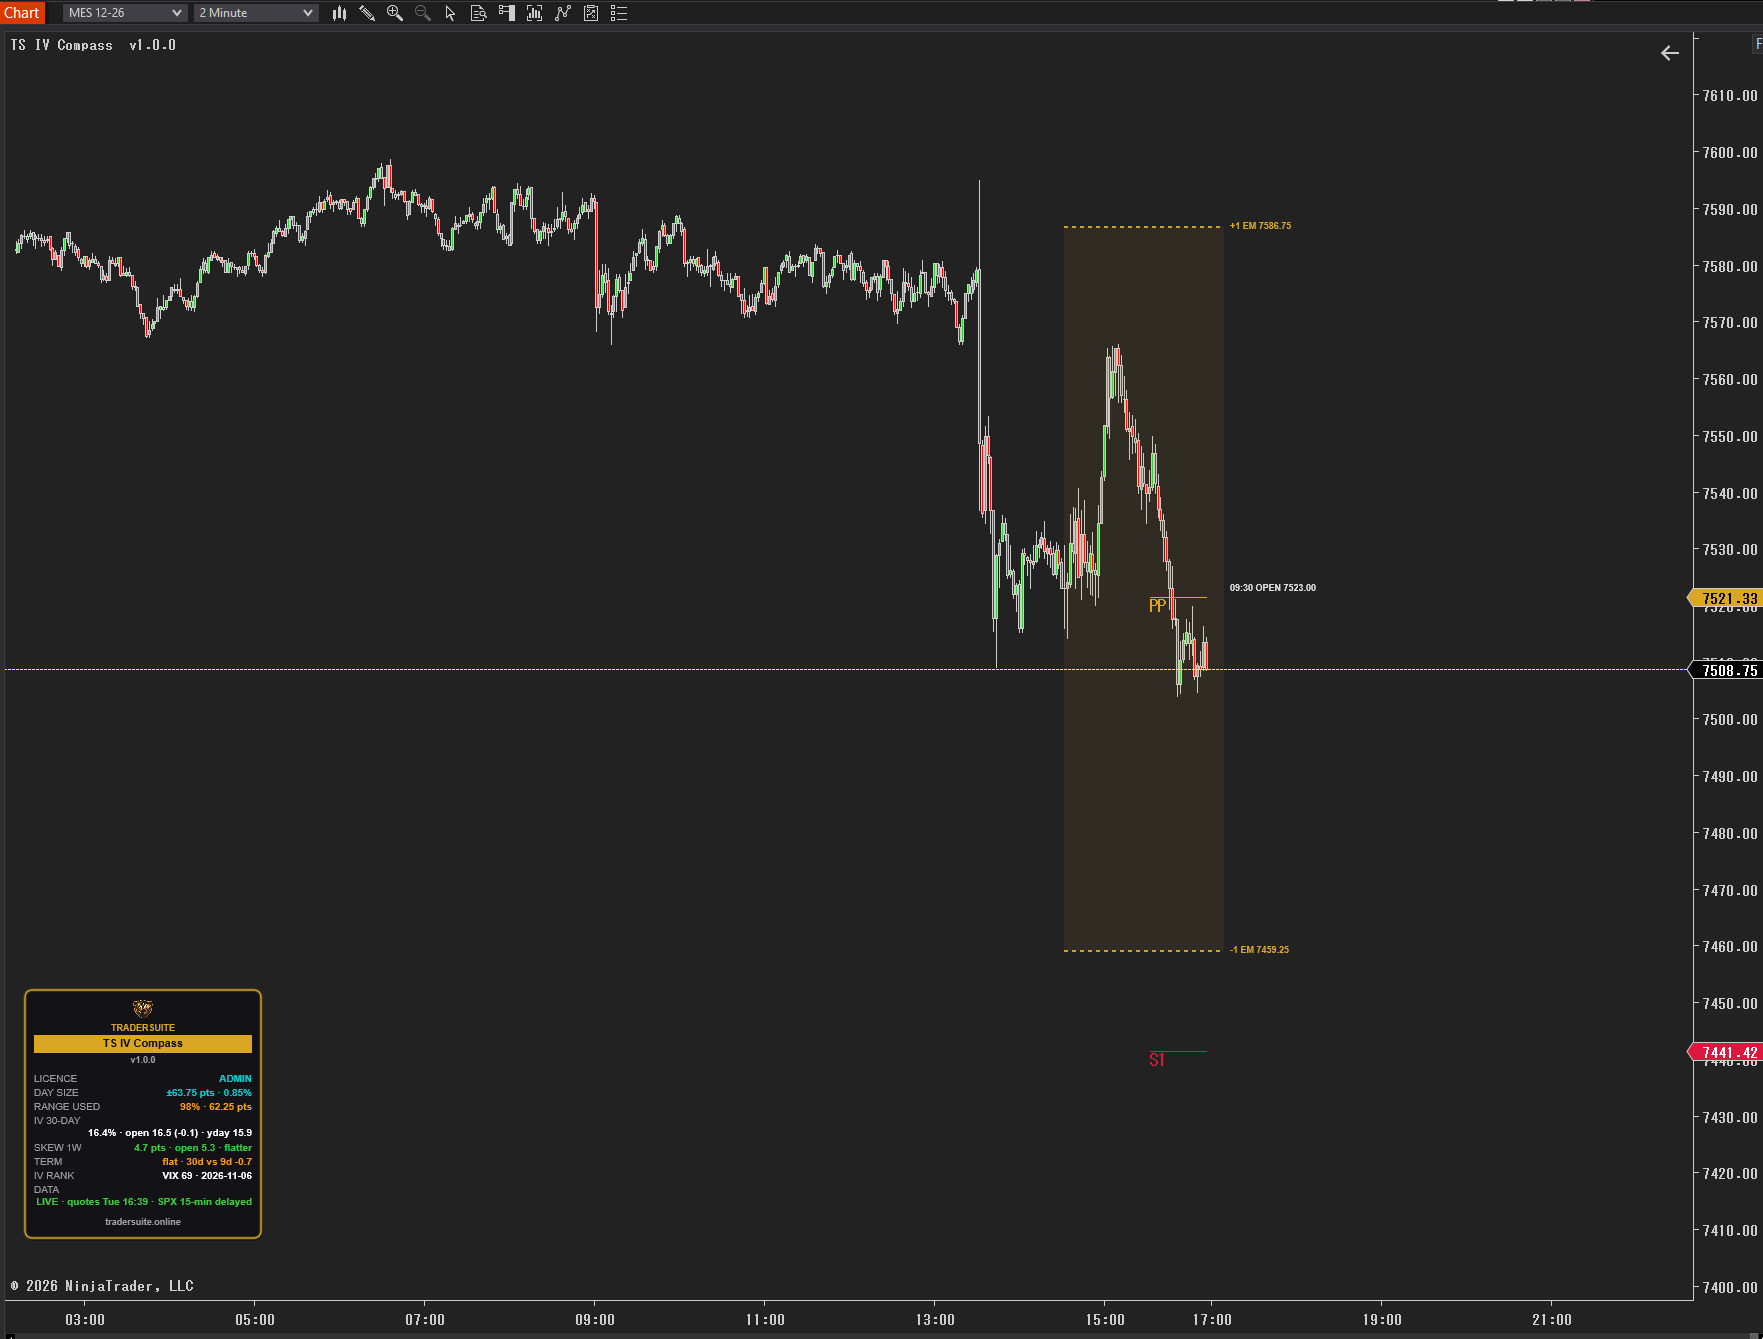
How big a day is the options market expecting? TS IV Compass reads it from the option prices and draws it on your NinjaTrader 8 chart, so you can plan stops, targets and size before you trade.
What you see on the chart
- Expected-move bands – today's 09:30 open ± the move the options market prices for the session (one standard move), locked at the open.
- Day type – QUIET, NORMAL or WILD, worked out from the day size, the term shape and the IV rank. The panel border takes its colour.
- Range gauge – a small fuel gauge: how much of the expected move the day has already used, and the points left.
- Fear readings – 30-day IV now vs the open and vs yesterday, the 1-week skew, the term shape (normal / flat / inverted) and the IV rank (VIX for ES, VXN for NQ).
- Rich strikes – option strikes where traders are paying well over the odds, shown as futures prices.
- Alerts – IV crush or climb, the day type, and range used reaching your caution level or 100 %.
The data comes from Cboe's delayed option chains (about 15 minutes old) through the TraderSuite server: SPX / SPY options for ES and MES, QQQ / NDX options for NQ and MNQ. Everything is worked out on closed candles. It is built for the plan before the bell and the slow changes through the day, not for split-second entries.
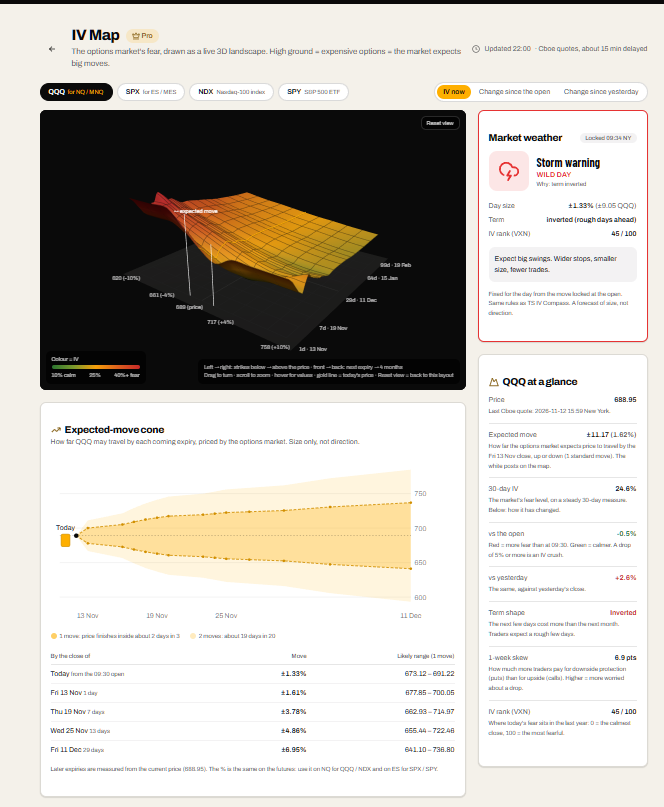
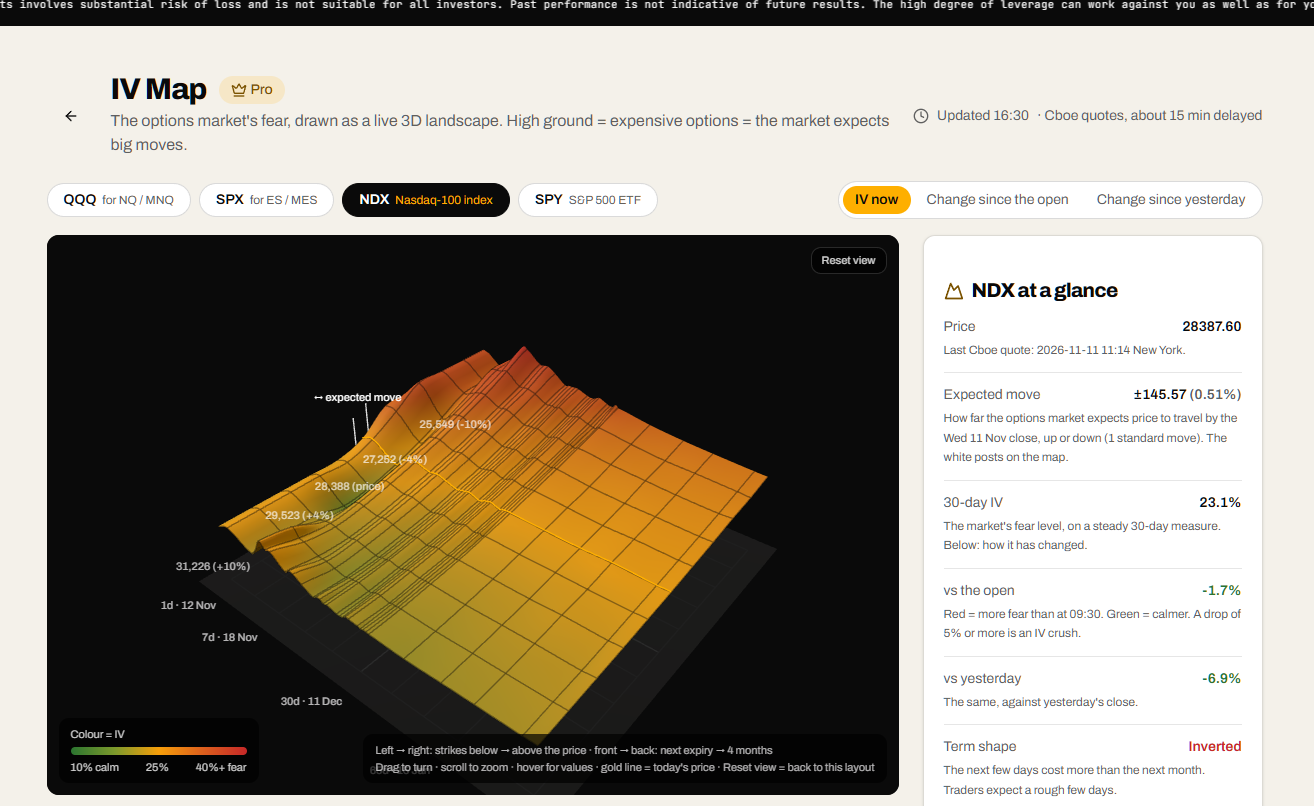
Pro members can also open the IV Map on the website: the same data as a live 3D landscape, with the market weather card and the expected-move cone.
TS IV Compass shows the size of the move the market expects, not its direction. It is a tool for reading the market and getting alerts. It is not a signal service and does not place trades. Trading futures carries a high risk of loss.
Demo del producto
Productos relacionados
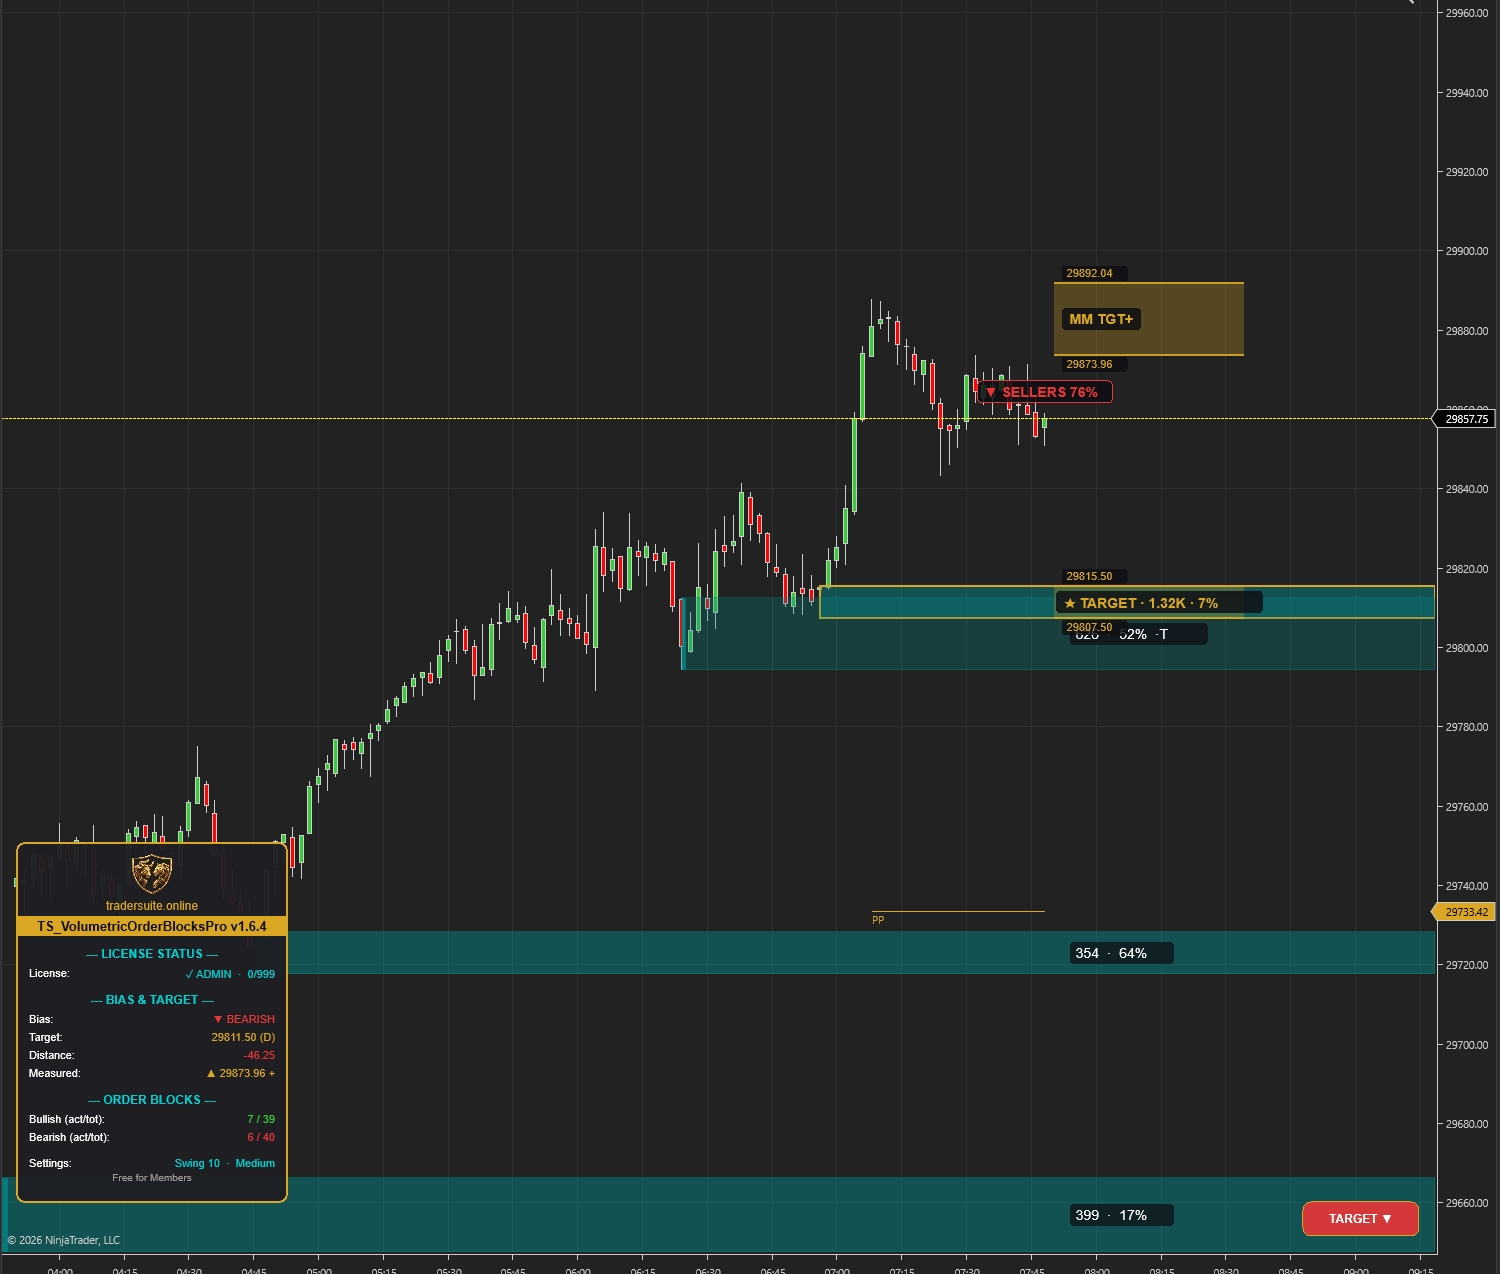
Volumetric Order Blocks Pro
Detecta automáticamente zonas institucionales de oferta y demanda con order blocks ponderados por volumen. Identifica posibles zonas de giro donde está posicionado el smart money.
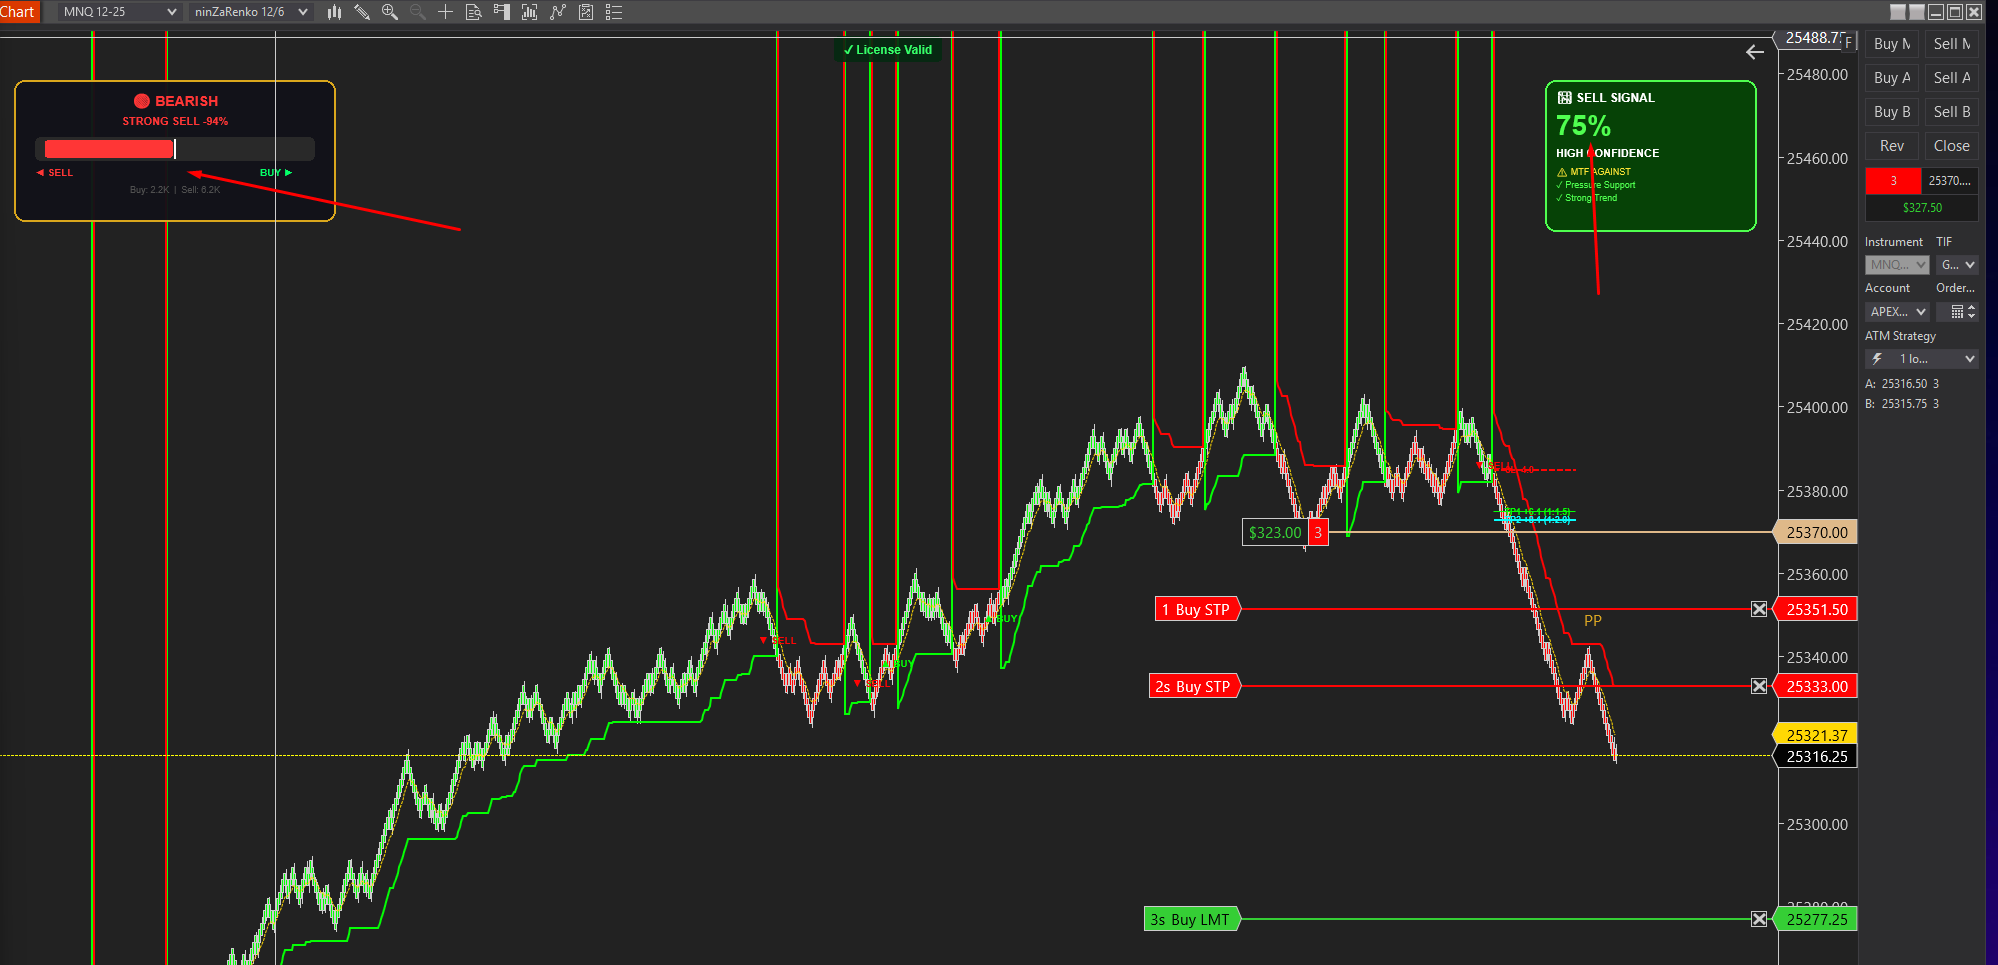
Smartflowpro
Análisis avanzado de order flow con Pressure Delta Meter en tiempo real, puntuación de confluencia multi-timeframe y valoración inteligente de la probabilidad de la señal. Mira quién tiene el control antes de operar.
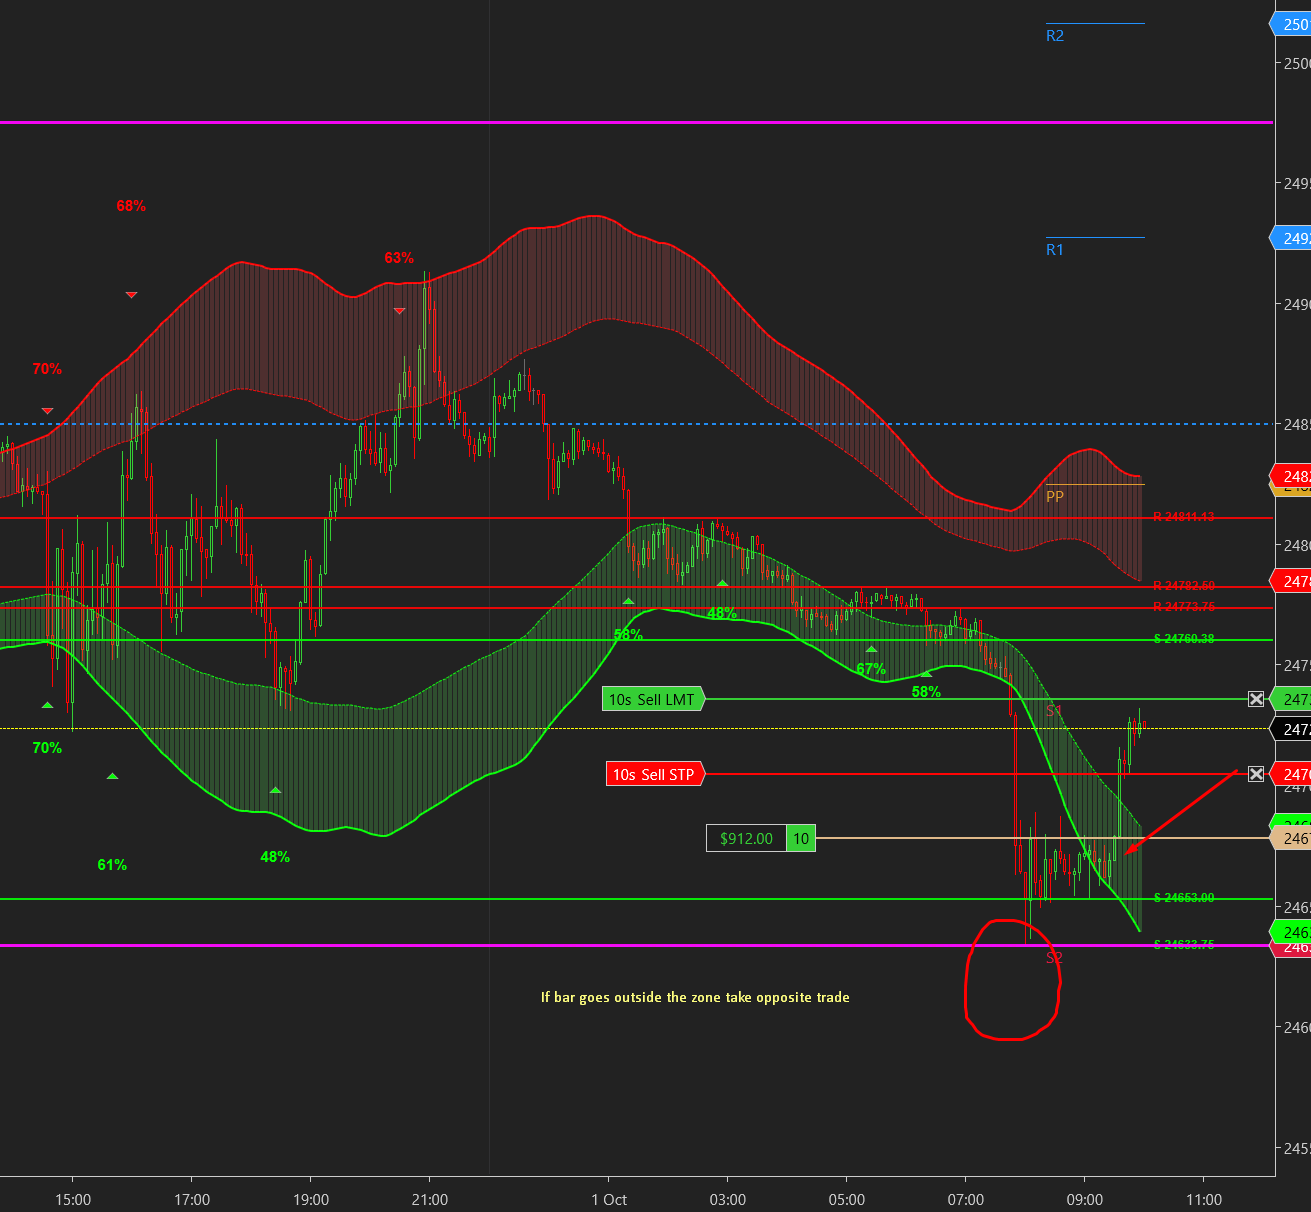
UltraADXVolatilityWaves
Indicador profesional de zonas de volatilidad basado en ADX, con soportes/resistencias dinámicos, niveles diarios/semanales, objetivos TP/SL basados en ATR y señales con puntuación de probabilidad. Identifica posibles zonas de reversión en tiempo real.
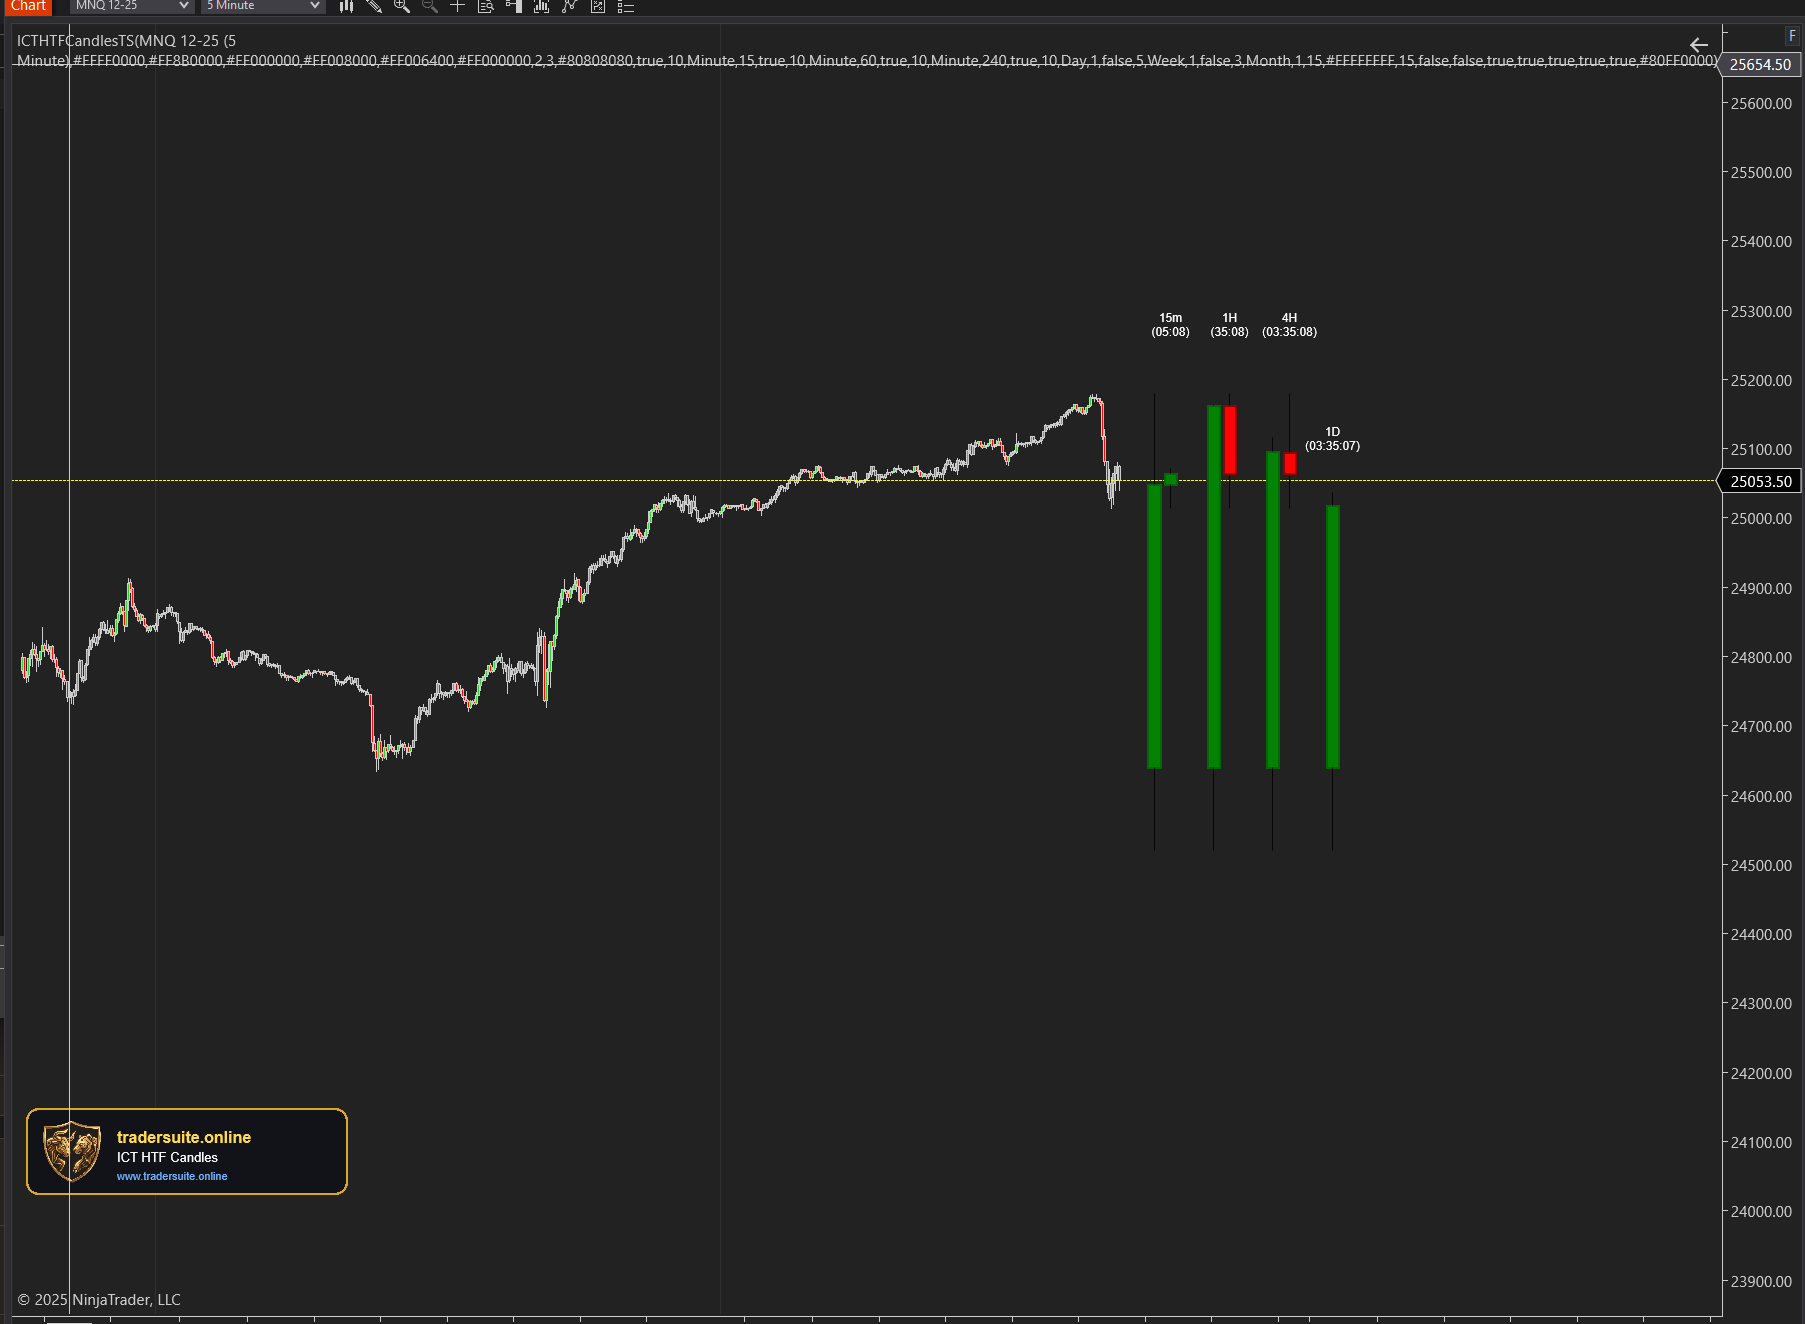
ICT HTF Candles Pro
Visualiza varias velas de temporalidad mayor directamente en tu gráfico, con temporizadores de cuenta regresiva en tiempo real, detección de Fair Value Gaps y resaltado de Volume Imbalances. Ideal para traders ICT que necesitan confluencia multi-temporalidad sin cambiar de gráfico.