TS_MeasuredMove_Pro
Automatically finds A-B-C swing structures and projects measured-move target zones with invalidation levels — plus live hit-rate stats that prove the edge on your instrument.
Secure Download
Instant access
Lifetime Updates
Free forever
2 Activations
Per license
Documentation
Step-by-step guides
TS_MeasuredMove_Pro
The visual guide — how to read every line on your chart, and how to trade what the indicator shows you.
What is a measured move?
Markets trend in steps: a strong impulse leg, a pullback, then a continuation that tends to travel about the same distance as the first leg. Research on 1,000+ setups shows continuations most often resolve at 70–100% of the prior leg — which is why the indicator projects a zone, not a single magic line.
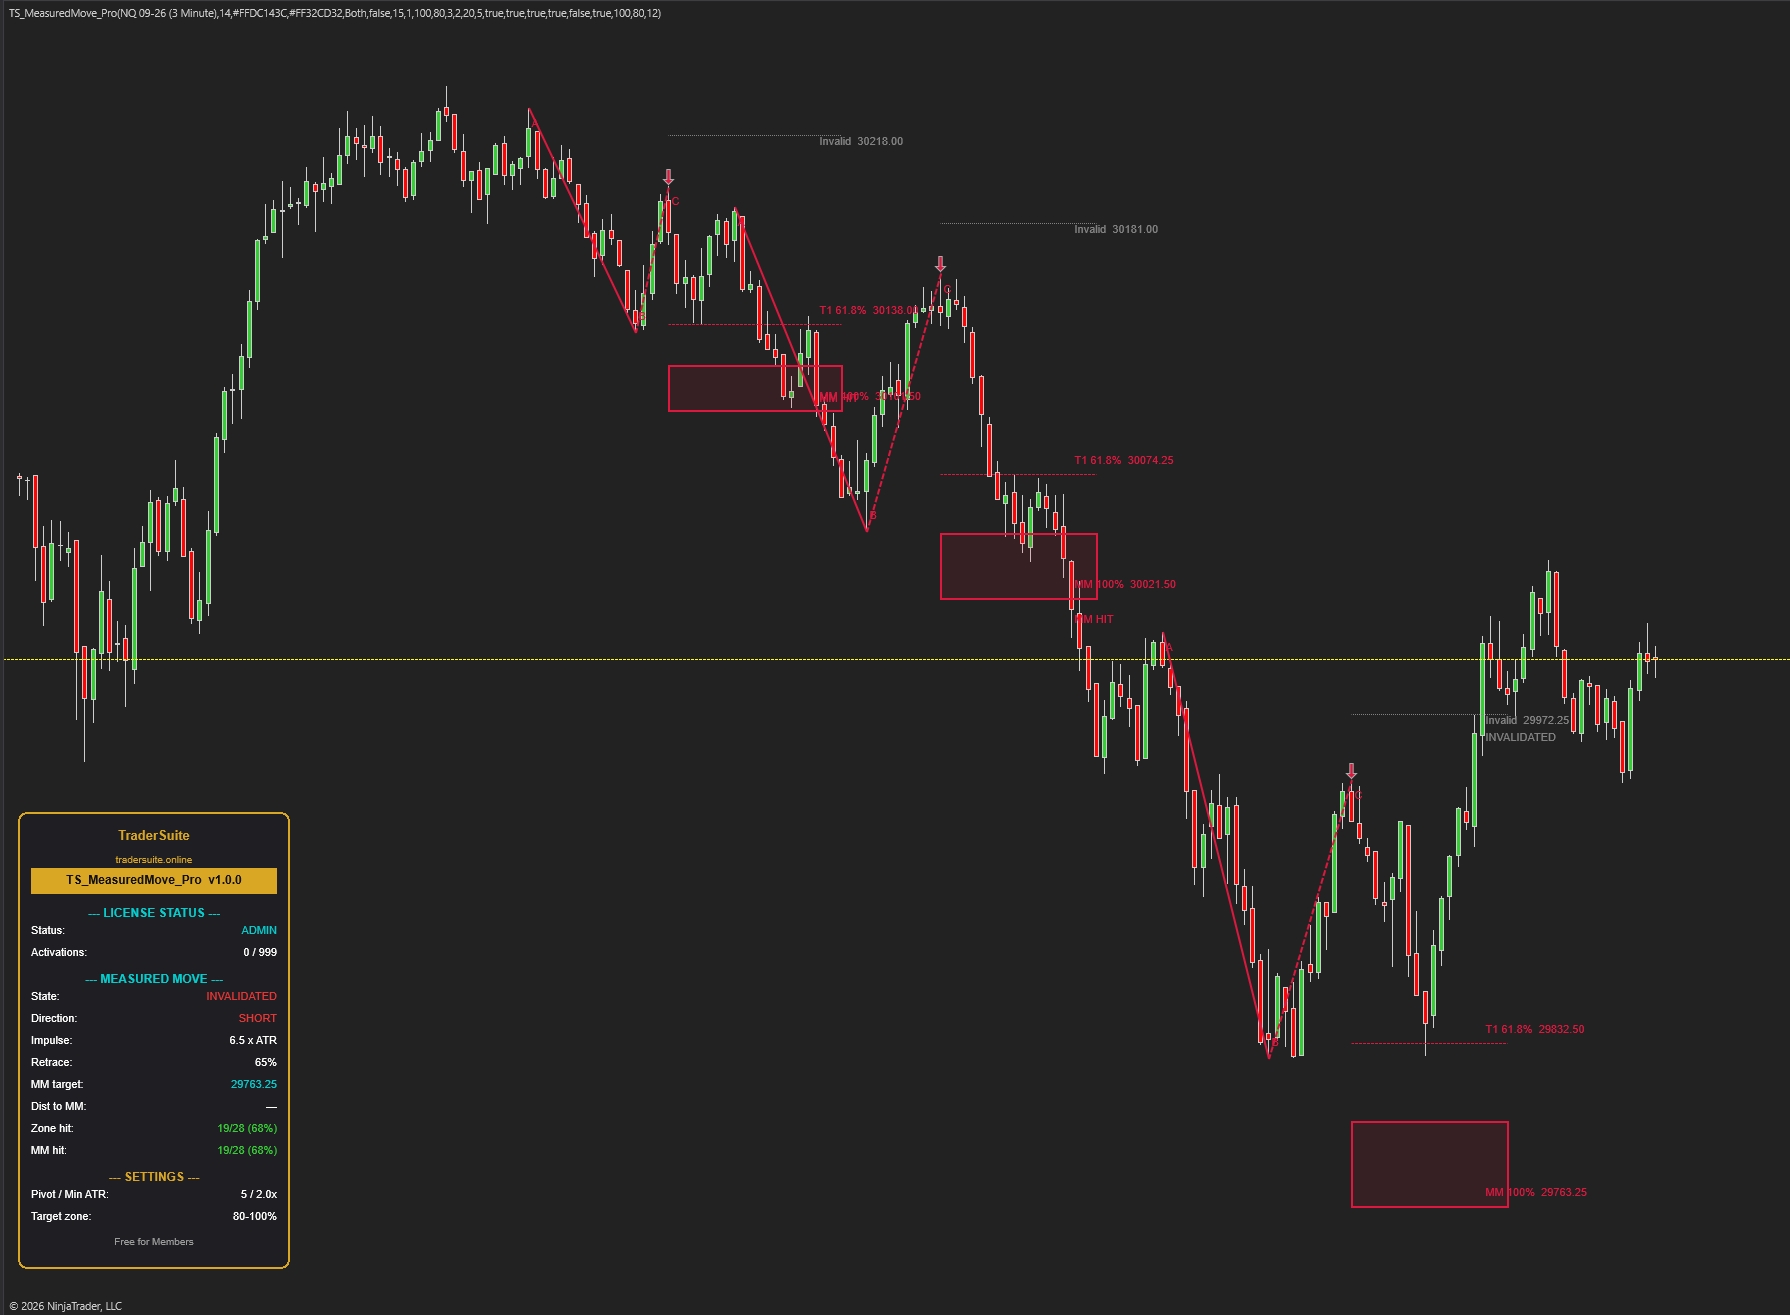
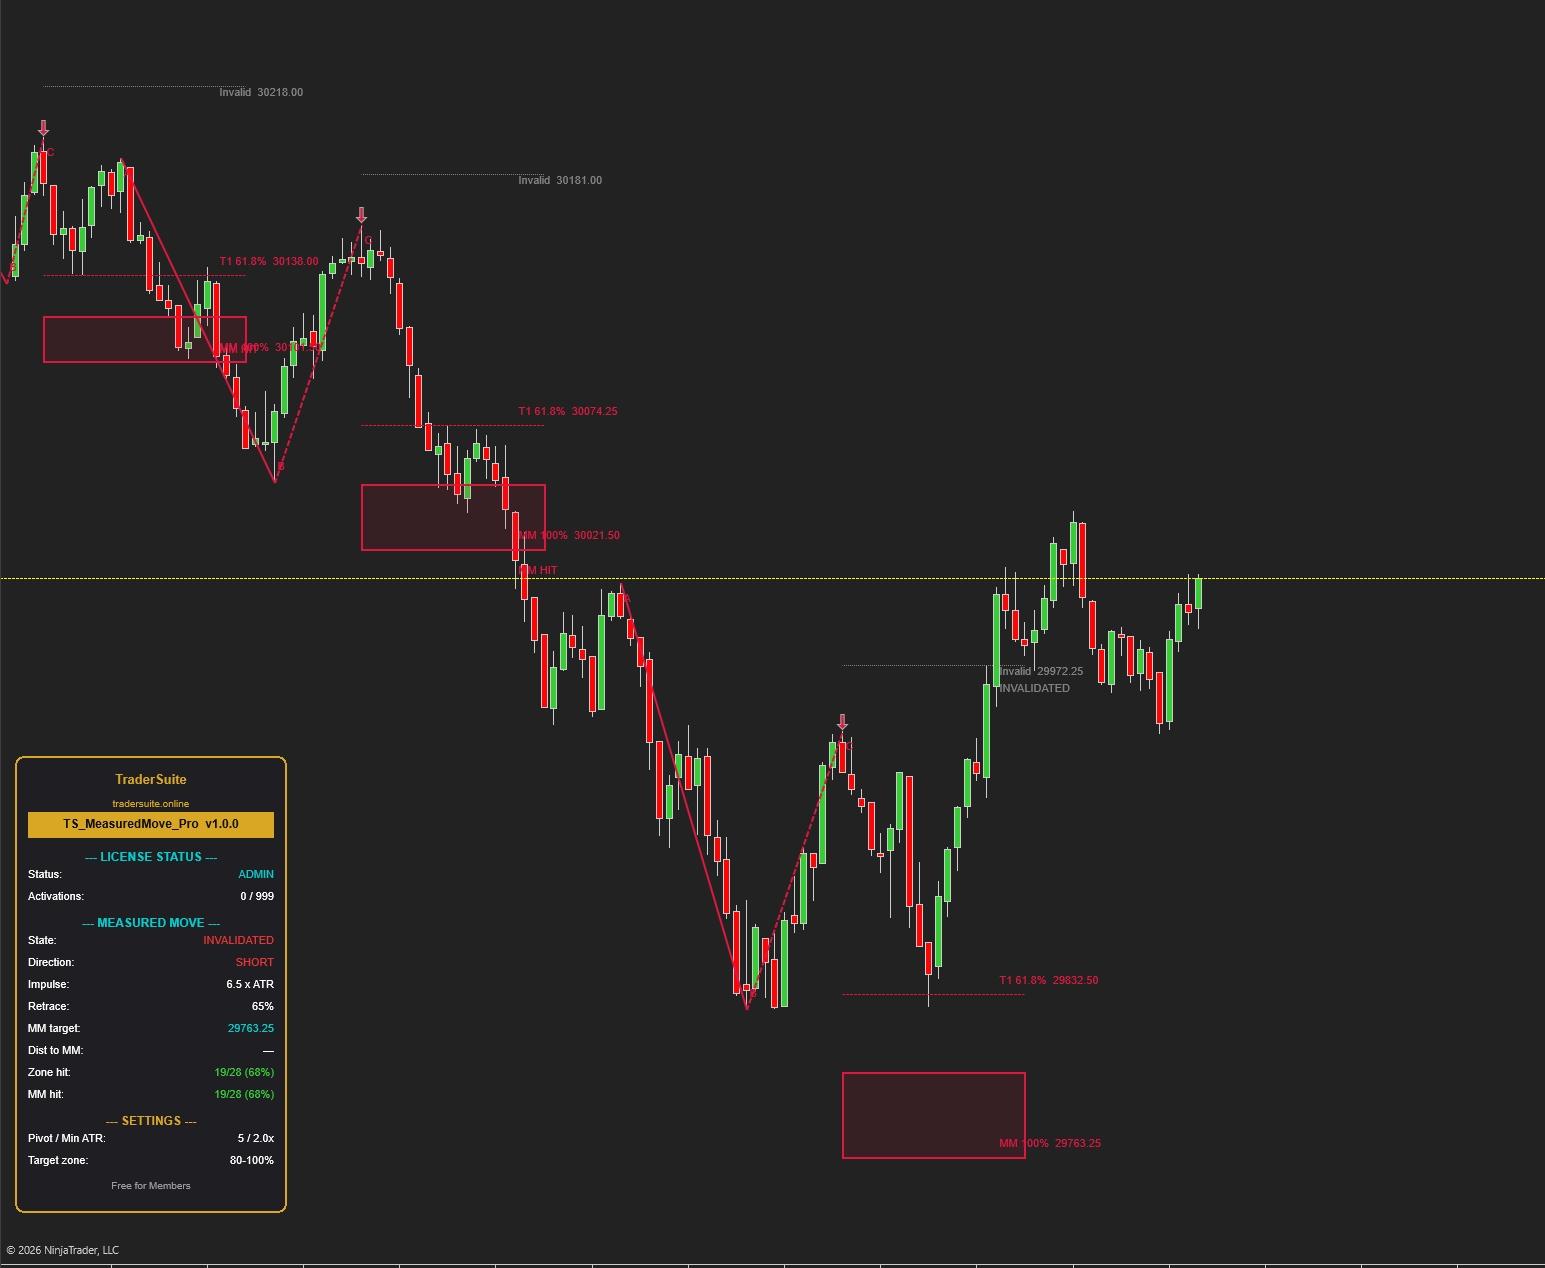
Anatomy of a setup — every element explained
This is exactly what TS_MeasuredMove_Pro draws. Toggle between long and short — they are perfect mirrors.
The life of a setup
Every structure moves through explicit states. The current state is always shown in the panel, and each resolution prints a label on the chart.
WAITING
No qualified structure. The indicator is tracking swings silently — do nothing.
ARMED
A, B and C all validated; arrow printed, zone projected. This is your decision window: plan entry, stop and target now.
MM HIT
Price touched the 100% target. Counted as a win in the hit-rate stats. If you're in, this is where profit-taking completes.
INVALIDATED
A bar closed beyond the gray line. The symmetry is broken — the market is telling you the trend is weaker than it looked. Never average into an invalidated setup.
EXPIRED
100 bars passed (default) without target or invalidation. Stale structure, discarded honestly — counted in stats as a non-hit.
Note: if a fresh, better structure qualifies while one is still ARMED, the old one is superseded — removed from the chart and excluded from hit-rate stats (it never resolved).
Reading the TraderSuite panel
Bottom-left of your chart. The values below are from a real NQ 5-minute session.
The 5-step playbook
The indicator finds the structure and does the math. Your job is entry quality and risk discipline.
Wait for the arrow — never anticipate it
An arrow means A-B-C is fully validated: impulse ≥ 2× ATR, retrace inside 20–80%. Before the arrow there is no setup, only hope.
Choose your entry model
Conservative: enter when price breaks back through B (structure confirms the new leg). Lower reward, higher win rate.
Aggressive: enter at/near the arrow bar close, as close to C as possible. More reward, more failed starts.
Stop goes at the gray line
The invalidation line sits 1 ATR beyond C (never beyond A). Place your stop just past it. If a bar closes beyond it, the setup is dead — exit without negotiation, the label will print INVALIDATED.
Take profit inside the zone — not at a fantasy price
The shaded 80–100% band is where most continuations stall. Scale a partial at T1 (61.8%), take the core off inside the zone. Only hold for T3 (127%) when momentum is clearly accelerating through 100%.
Let the hit-rate rows judge the tool
Before sizing up on any new instrument or timeframe, load a few weeks of data and read Zone hit / MM hit. 60%+ with your entry model = tradeable edge worth refining. Numbers don't care about opinions.
Worked example — the short from the NQ 5-minute chart
Risk ≈ 82 pts, reward ≈ 85–127 pts. Illustrative only — a 65% retrace is at the deep end of the window, which is exactly when you demand extra confluence or skip. Shallower pullbacks give materially better R:R.
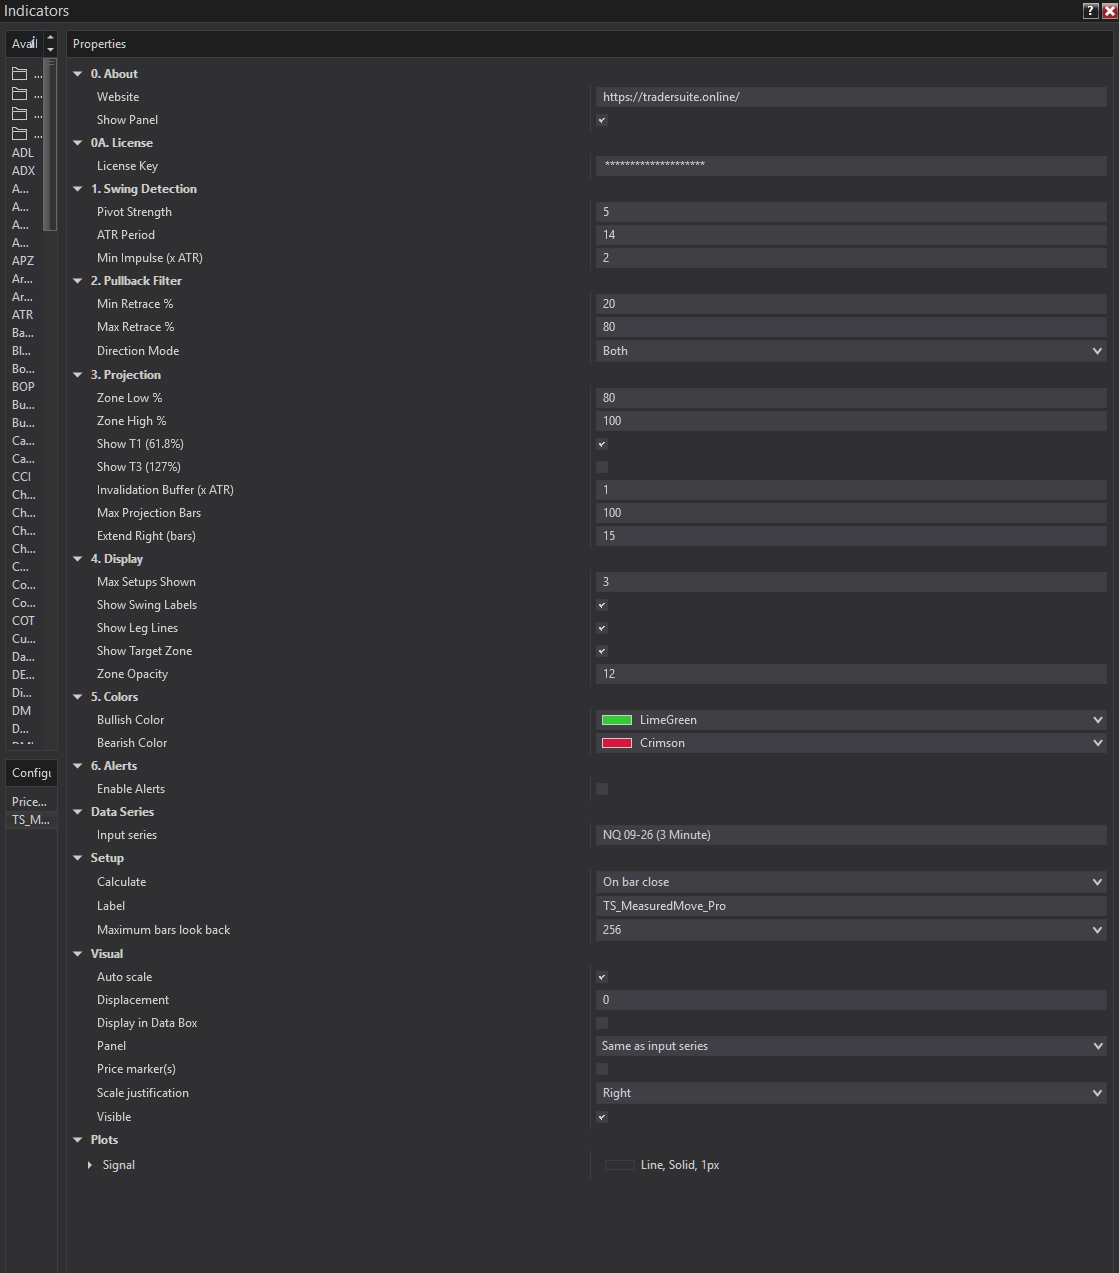
Settings that actually matter
Defaults are tuned for 1–15 minute futures. Three knobs control 90% of the behavior.
Pivot Strength
Bars required on each side to confirm a swing. The sensitivity dial: lower = more setups & faster arrows (and more noise); higher = fewer, cleaner structures with more confirmation lag.
Min Impulse (× ATR)
The noise gate. Raise it if the chart arms on legs you'd never trade; lower it on quiet instruments that rarely print 2-ATR legs.
Min / Max Retrace %
The pullback window. Tighten to 20/60 to only trade strong-trend continuations; the research sweet spot is 20–50%.
Zone Low / High %
The projection band. 80–100 is the classic measured-move zone. Extension hunters can run 100/127.
Invalidation Buffer (× ATR)
How much room beyond C before the structure is declared broken. Tighter = earlier exits, more false invalidations; wider = more room, worse stops.
Direction Mode
Long only / Short only / Both. Align it with your higher-timeframe bias to filter counter-trend structures automatically.
| Setting | Scalping 1–3m | Intraday 5–15m (default) | Swing 1H+ |
|---|---|---|---|
| Pivot Strength | 4 | 5 | 8–10 |
| Min Impulse × ATR | 1.5 | 2.0 | 2.5–3.0 |
| Max Retrace % | 70 | 80 | 80 |
| Max Projection Bars | 60 | 100 | 150 |
| Max Setups Shown | 2 | 3 | 5 |
Do & Don't
Do
- Trade in the direction of the higher-timeframe trend — measured moves are continuation tools.
- Demand confluence on deep (50–80%) retraces: a level, VWAP, or a rejection candle at C.
- Treat the zone as the destination and manage the exit by momentum inside it.
- Respect INVALIDATED labels — a failed measured move is real information about trend weakness.
- Audit the hit-rate rows per instrument and timeframe before sizing up.
Don't
- Don't chase price already deep inside the zone — the reward is spent.
- Don't expect the exact 100% tick; the zone exists because symmetry is approximate (spectrum, not a magic number).
- Don't use an old up-leg to project a down-move — swing asymmetry makes opposite-direction projections unreliable.
- Don't average into an invalidated setup, ever.
- Don't trade the arrow on a news bar — a 6×+ ATR panic impulse breaks the "normal volatility" assumption.
Hands-free operation
Enable alerts in group 6. Alerts — you'll get a real-time popup + sound when a setup ARMS, when the MM target is HIT, and on INVALIDATION. For NinjaScript strategies, consume the Signal plot:
// +1 = long structure armed, -1 = short structure armed, 0 = nothing
var mm = TS_MeasuredMove_Pro(/* your parameters */);if (mm.Signal[0] == 1 && Close[0] > EMA(200)[0])   // trend filter example
    EnterLong();
else if (mm.Signal[0] == -1 && Close[0] < EMA(200)[0])
    EnterShort();
The signal fires on the arrow bar (C confirmation). Pair it with your own trend filter and use the invalidation level and MM price for stop/target placement.
FAQ
Why does the arrow appear several bars after the actual low/high?
Pivot confirmation needs Pivot Strength bars (default 5) to the right of the turn before C is proven. That lag is the price of clean, repaint-free anchors — the indicator never redraws a confirmed structure backwards.
Too many setups / chart looks noisy — what do I change?
Raise Min Impulse to 2.5–3.0× ATR first, then Pivot Strength to 6–8. Lower Max Setups Shown to 2 to keep only recent structures on screen. Tighten Max Retrace to 60% to drop the sloppiest patterns.
Almost no setups appear — what now?
Lower Min Impulse to 1.5× ATR and Pivot Strength to 4. Quiet instruments and slow sessions simply produce fewer 2-ATR impulse legs — that's the filter doing its job.
Zone hit and MM hit show the same number — bug?
No. Zone hit counts setups that reached the 80% level; MM hit counts full 100% touches. When they're equal, every setup that reached the zone also completed the full move — common on trending instruments like NQ. In choppier conditions Zone hit will exceed MM hit.
"Dist to MM" shows "—"
There is no ARMED setup right now. The row only tracks live distance while a projection is active.
Can it repaint?
Confirmed structures never repaint. One nuance: while a pullback is still deepening, a lower C (long) can supersede the current structure with an updated projection — you'll see the zone re-anchor once. After resolution, everything is frozen.
Does it work on stocks / crypto / higher timeframes?
Yes — the logic is ATR-normalized so it adapts to any instrument. Use the preset table above for timeframe tuning, then verify with the hit-rate rows before trading it.
Related Products
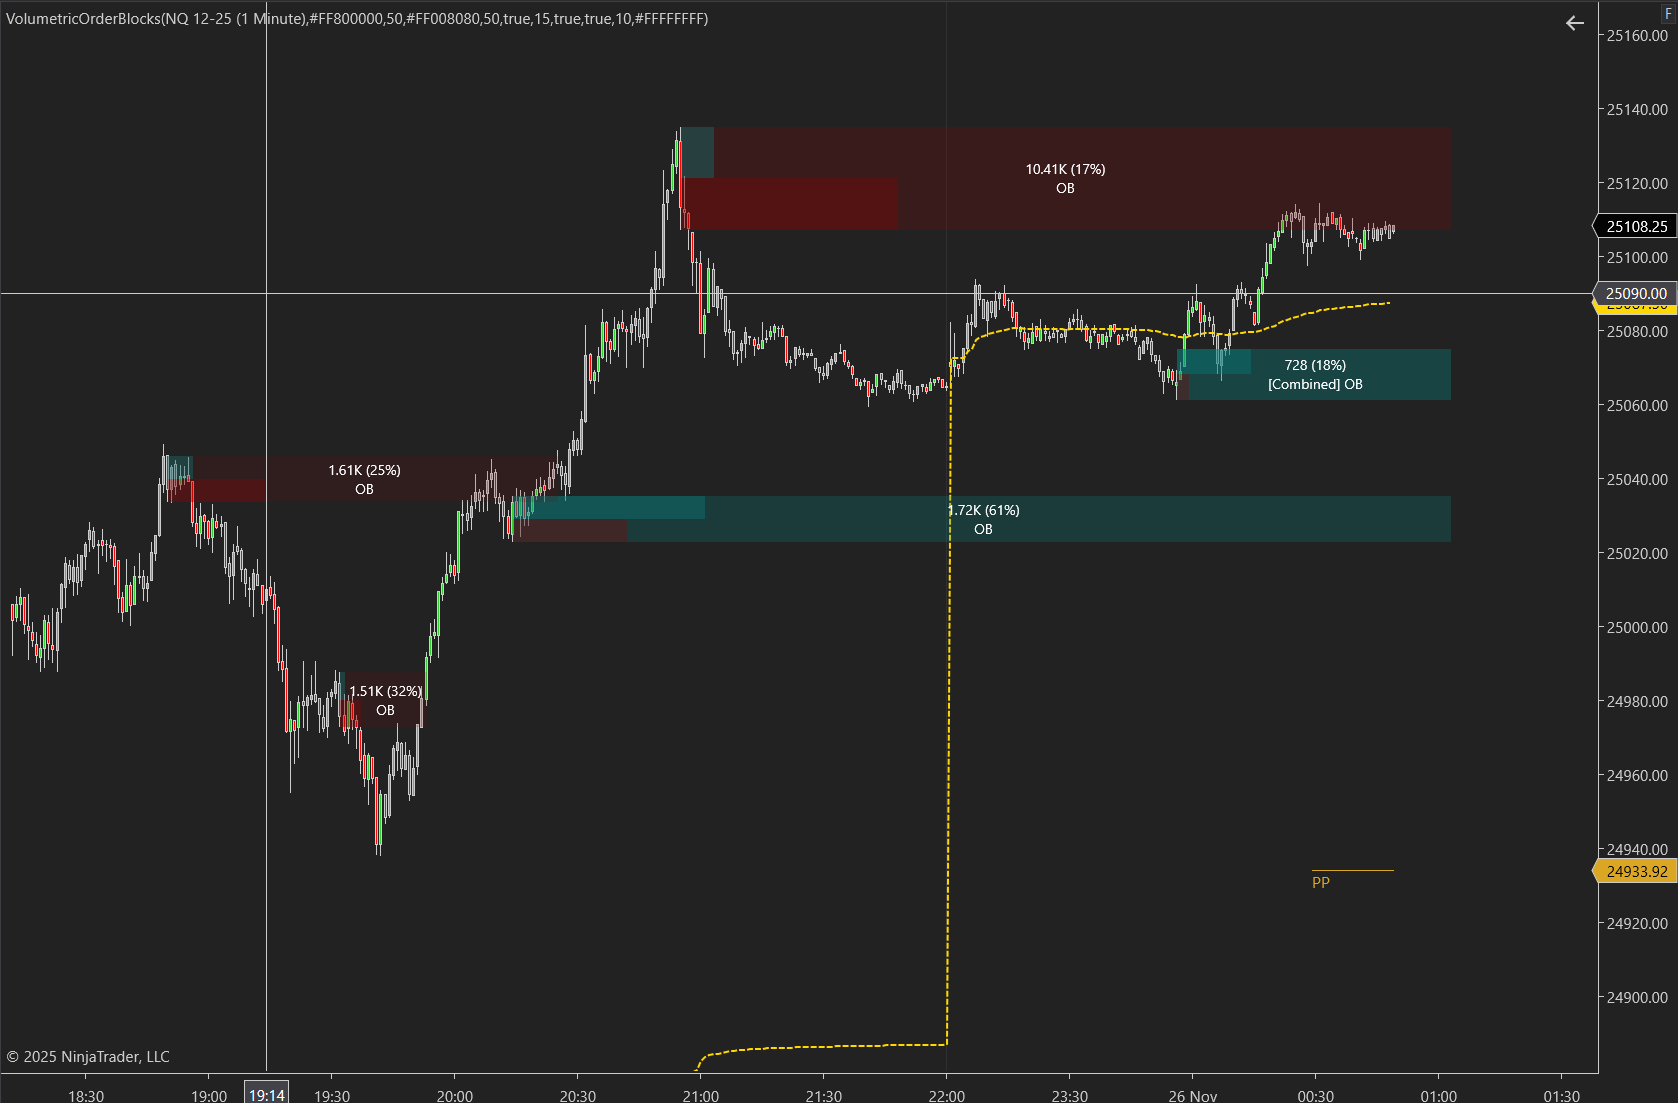
Volumetric Order Blocks Pro
Automatically detect institutional supply & demand zones with volume-weighted order blocks. Identify high-probability reversal zones where smart money is positioned.
Smartflowpro
Advanced order flow analysis with real-time Pressure Delta Meter, multi-timeframe confluence scoring, and intelligent signal probability rating. Know who's in control before you trade.
UltraADXVolatilityWaves
Professional ADX-powered volatility zones indicator with dynamic Support/Resistance, Daily/Weekly levels, ATR-based TP/SL targets, and probability-scored signals. Identify high-probability reversal zones in real-time.
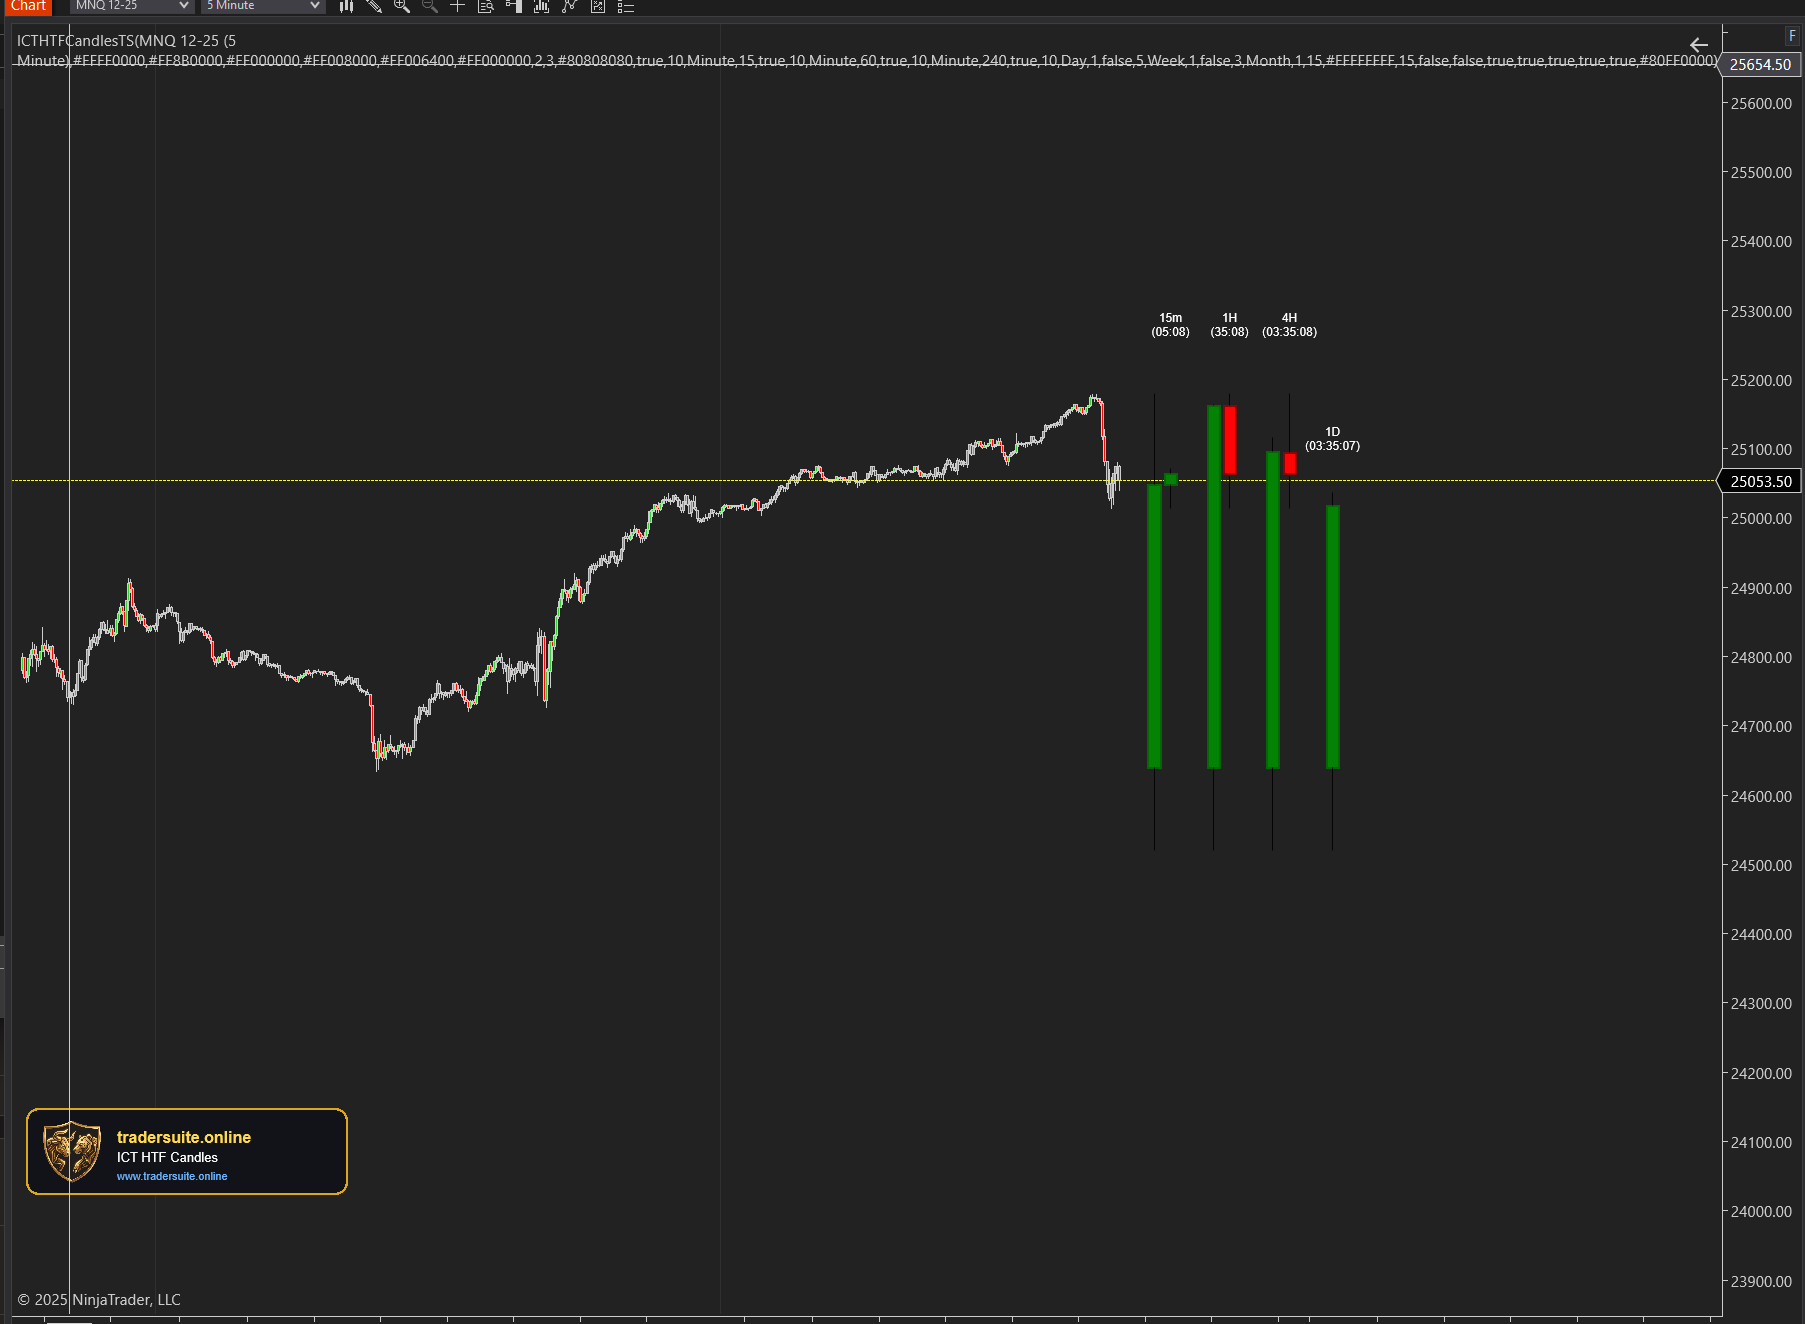
ICT HTF Candles Pro
Visualize multiple higher timeframe candles directly on your chart with real-time countdown timers, Fair Value Gap detection, and Volume Imbalance highlighting. Perfect for ICT traders who need multi-timeframe confluence without switching charts.
