
TS_DivergenceScreener_Pro
Automatic divergence detection on 8 oscillators — regular and hidden, bullish and bearish — with trend filtering, validity checks, glow-rendered lines and screener-ready outputs for Market Analyzer.
Secure Download
Instant access
Lifetime Updates
Free forever
2 Activations
Per license
Documentation
Step-by-step guides
TS_DivergenceScreener_Pro finds the divergences you'd never catch by eye — on every bar, across four types, without repainting. Price making a new high while momentum quietly weakens, or holding a higher low while the oscillator flushes: these disagreements between price and momentum precede many of the best reversals and continuations. This indicator detects them automatically and shows you exactly which kind you're looking at.
What it does
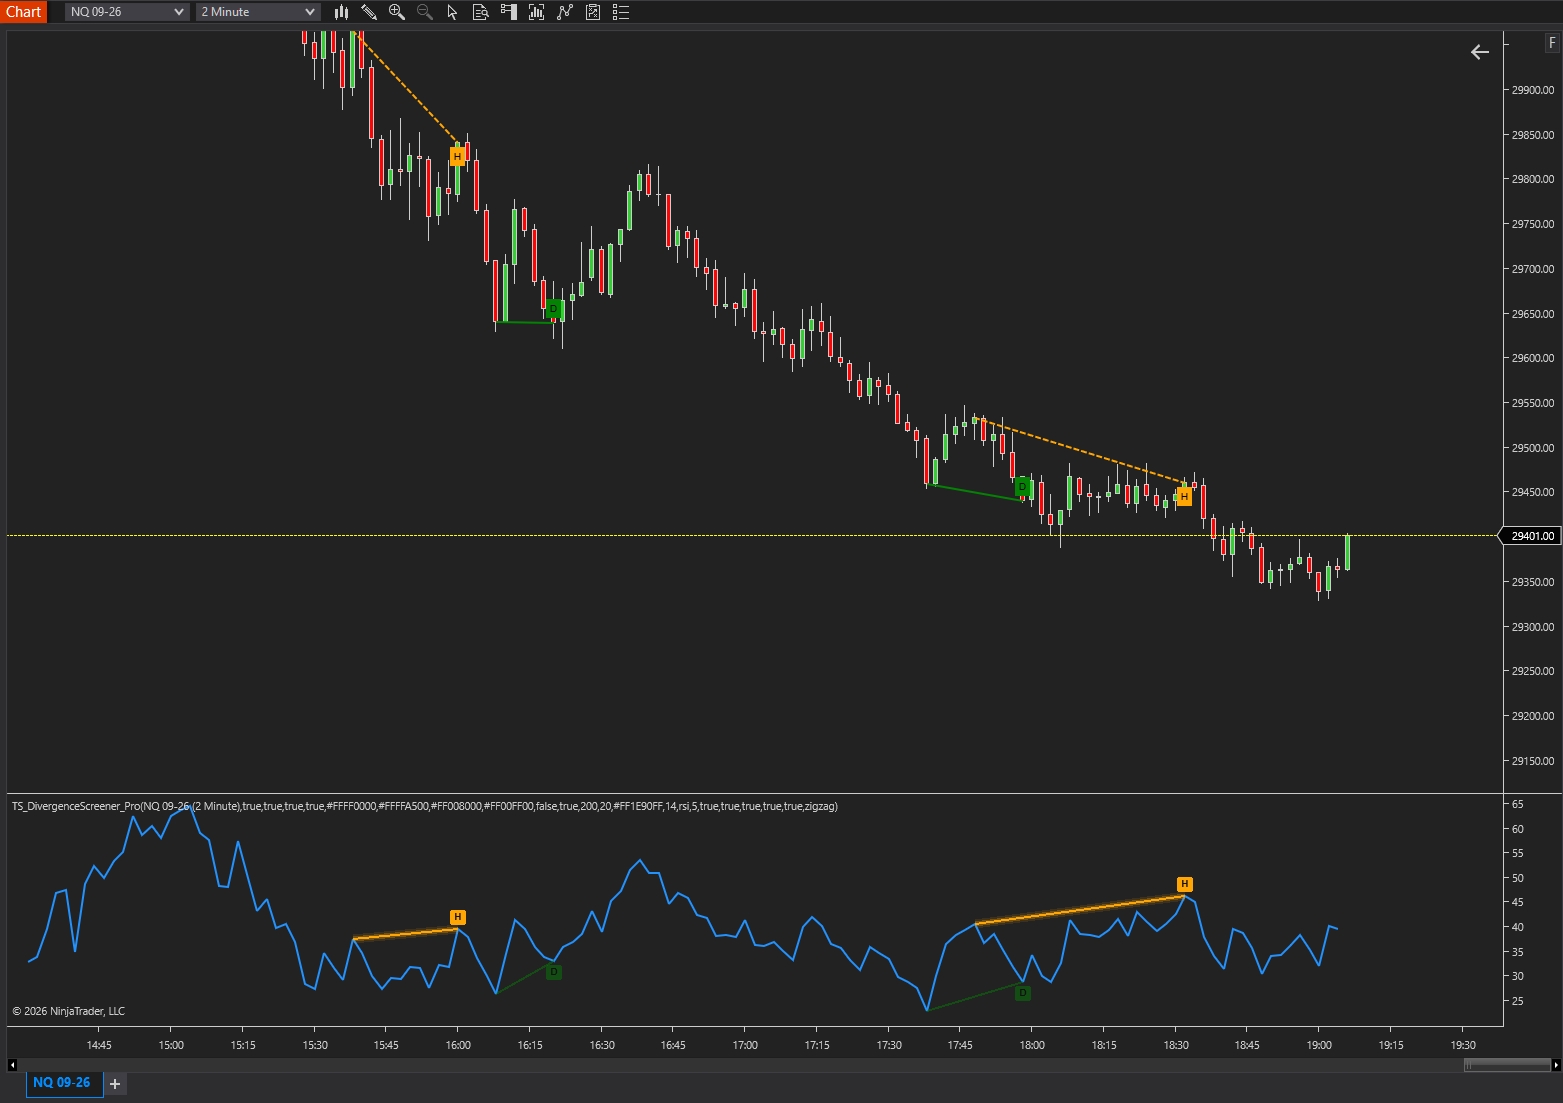
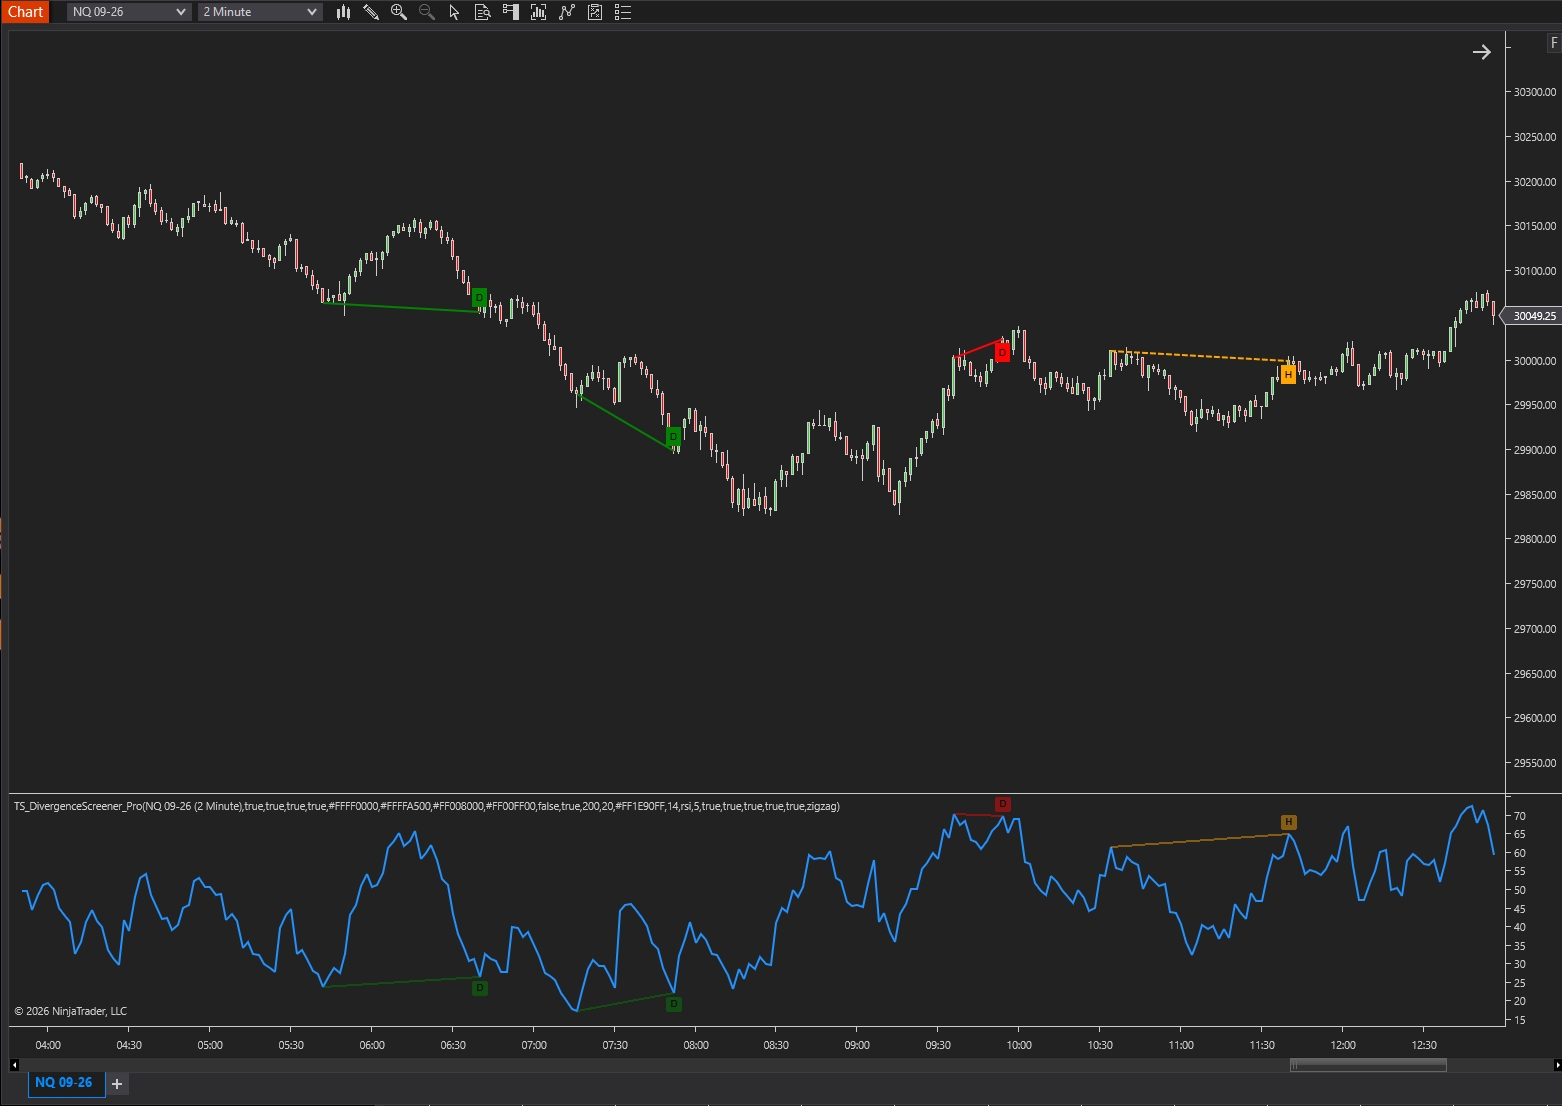
Choose from eight built-in oscillators — RSI, CCI, CMO, COG, MFI, ROC, Stochastic or Williams %R — and the indicator tracks swing pivots directly on the oscillator, comparing each confirmed pivot against the previous one on both price and momentum. When they disagree, it classifies the signal precisely: Bullish Divergence (reversal-up candidate in a downtrend), Bearish Divergence (reversal-down candidate in an uptrend), and their Hidden counterparts (trend-continuation signals). A trend filter validates every signal against market context, and a strict line-validity check discards any divergence whose connecting line was pierced in between — only clean, textbook structures make it to your chart.
Signals never repaint: detection waits for confirmed pivots, so the divergence you see in a backtest is the divergence you'd have gotten live. Each signal is then tracked to resolution — if price breaks beyond the signal pivot, the divergence is marked broken and dims on the chart, so stale signals never masquerade as active ones.
On-chart visualization
- Divergence lines drawn on the price panel connecting the actual pivots, color-coded by type (green / lime / red / orange — all editable)
- D / H chip labels marking regular vs hidden signals at a glance
- Oscillator panel with glow-rendered divergence lines — active signals glow, broken ones fade
- Branded TraderSuite dashboard: oscillator readout, trend method, last signal, live/broken state, and running counts per divergence type
The screener
Add the indicator as a Market Analyzer column and scan your entire watchlist for fresh divergences: the Signal output fires +2 / +1 / −1 / −2 on the detection bar (bullish, bullish hidden, bearish hidden, bearish), and LastActive keeps reporting the newest signal while it remains unbroken. The same outputs are consumable from NinjaScript strategies for full automation, and per-type real-time alerts cover discretionary trading.
Rebuilt natively for NinjaTrader 8, inspired by the popular open-source Divergence Screener concept by Trendoscope®.
Important note
TS_DivergenceScreener_Pro is a charting and decision-support tool. Divergences indicate momentum disagreement, not guaranteed reversals; they are context, not commands. For educational purposes only — not financial advice. Trading involves substantial risk of loss.
Related Products
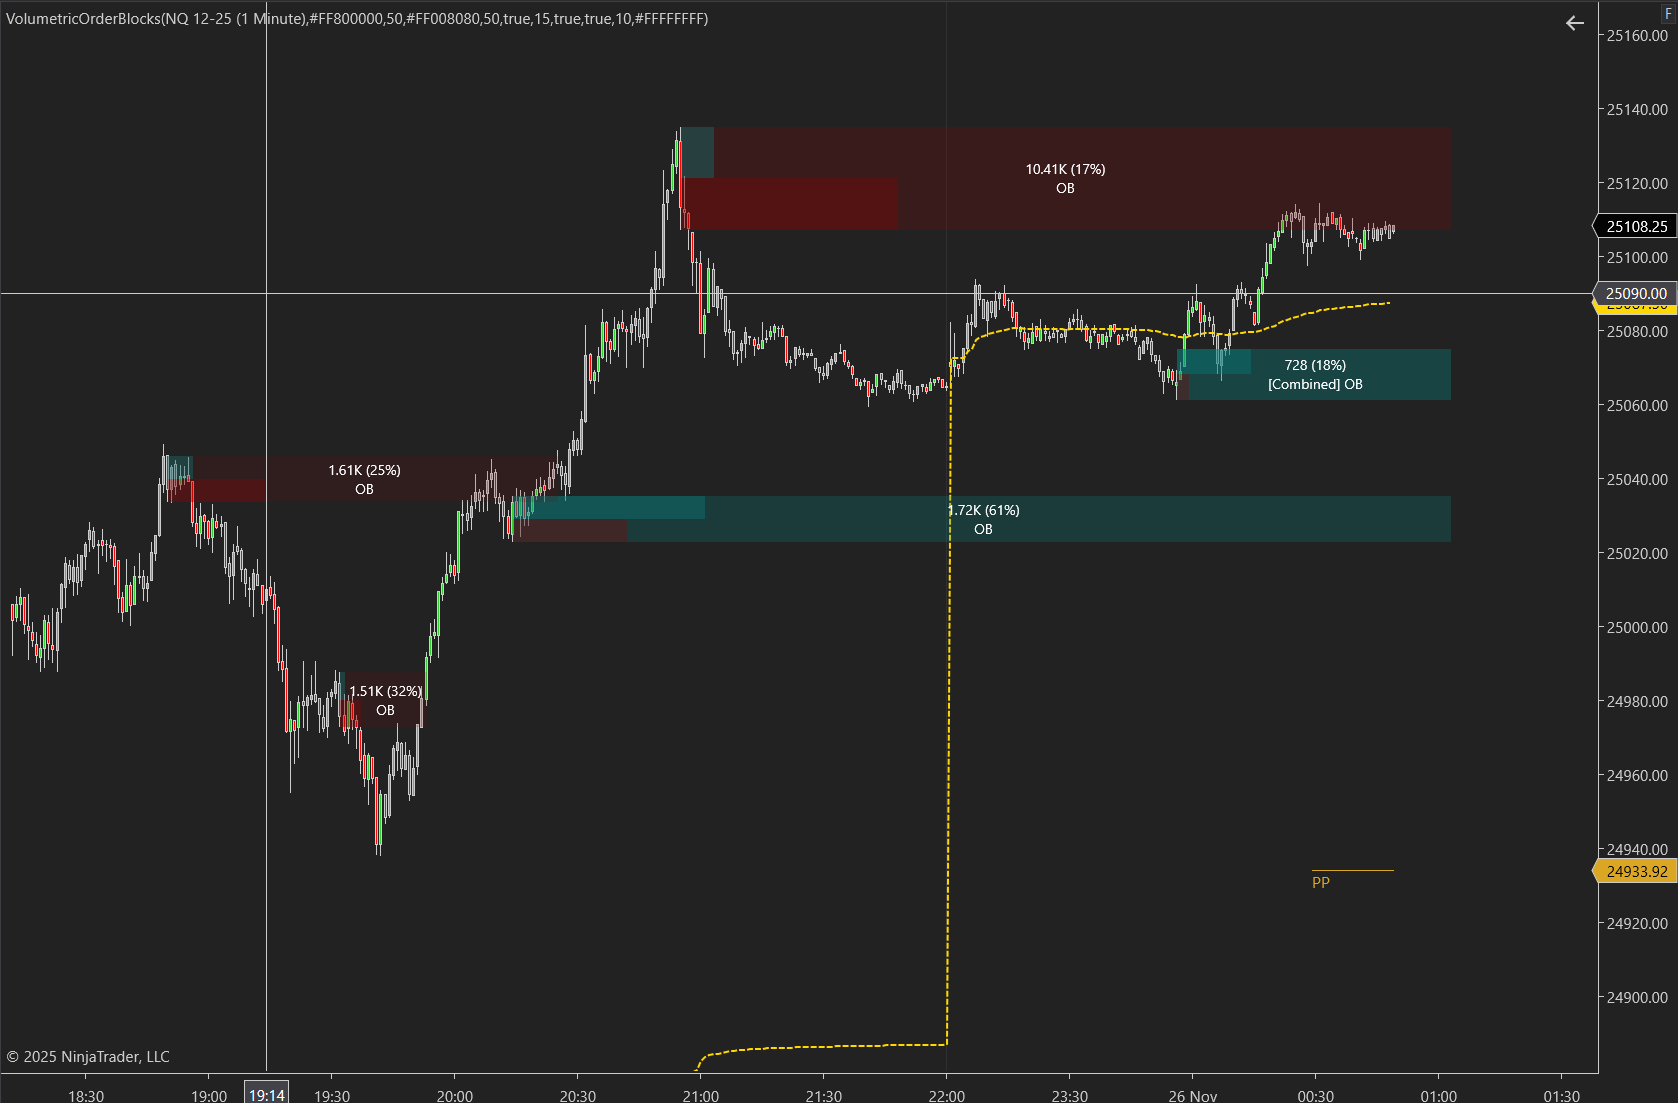
Volumetric Order Blocks Pro
Automatically detect institutional supply & demand zones with volume-weighted order blocks. Identify high-probability reversal zones where smart money is positioned.
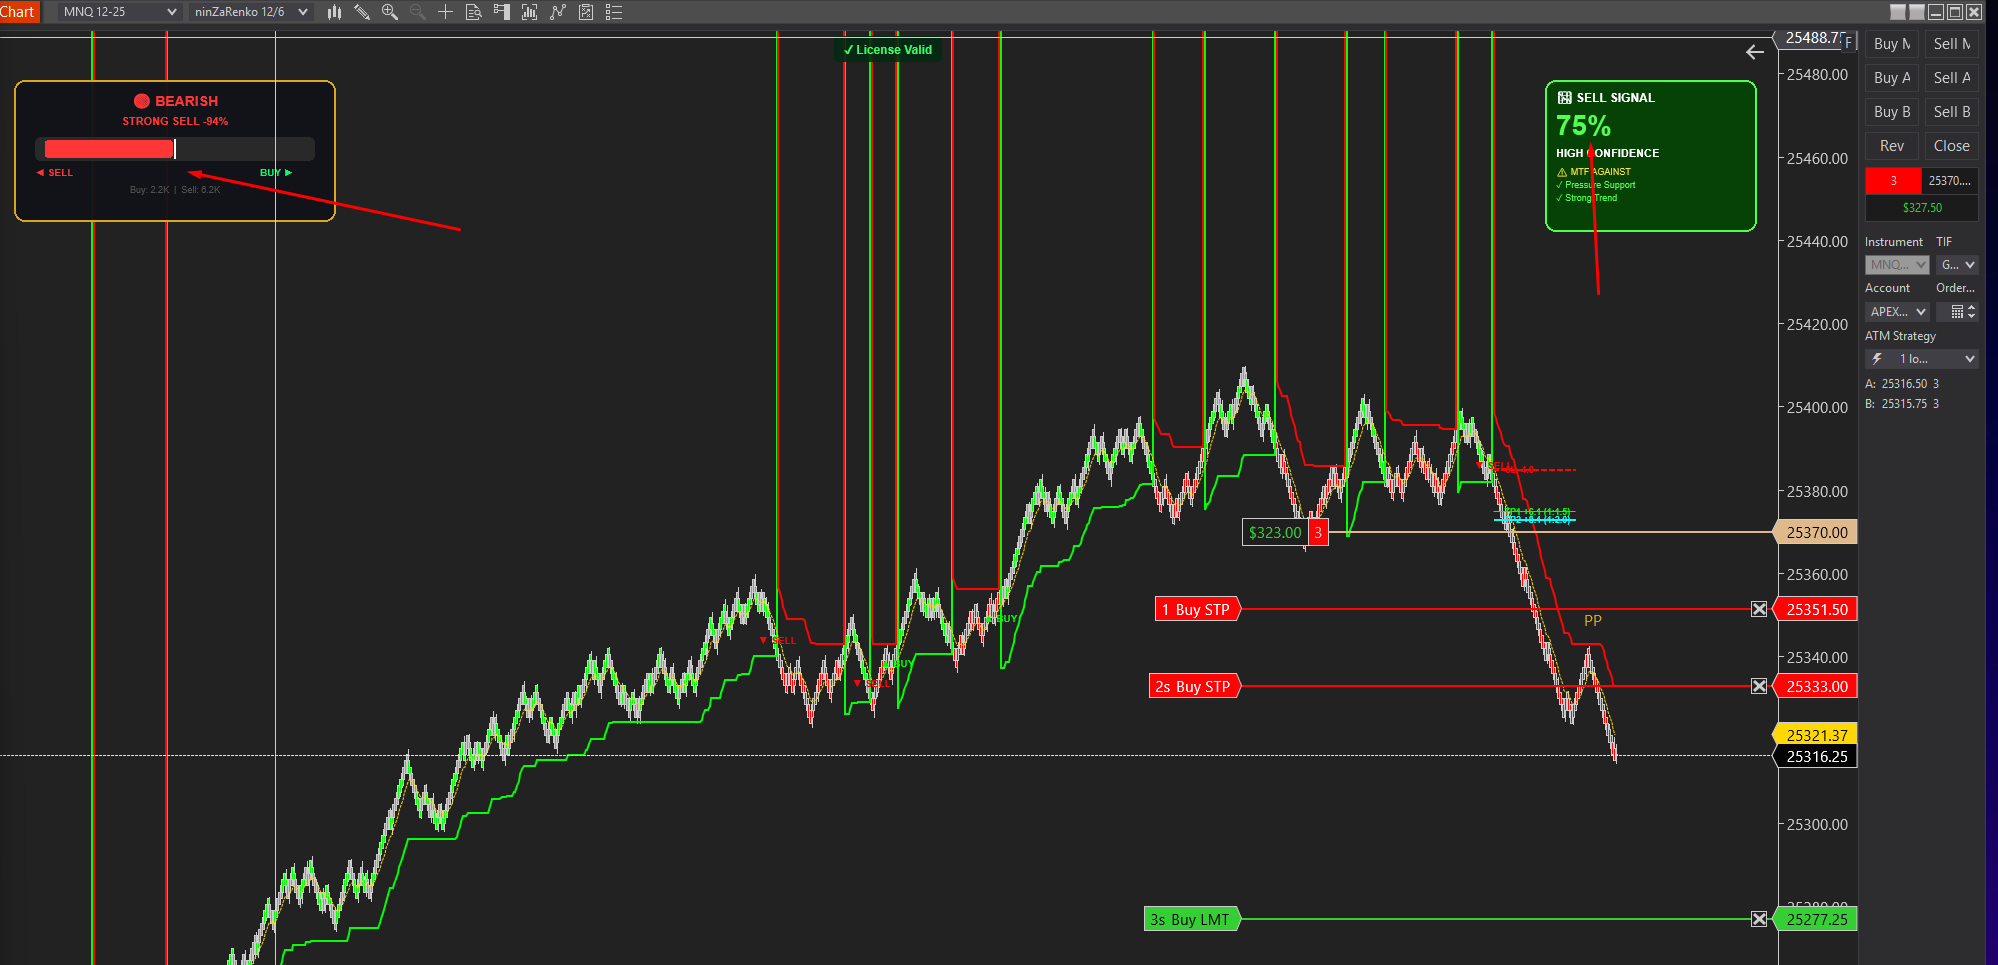
Smartflowpro
Advanced order flow analysis with real-time Pressure Delta Meter, multi-timeframe confluence scoring, and intelligent signal probability rating. Know who's in control before you trade.
UltraADXVolatilityWaves
Professional ADX-powered volatility zones indicator with dynamic Support/Resistance, Daily/Weekly levels, ATR-based TP/SL targets, and probability-scored signals. Identify high-probability reversal zones in real-time.
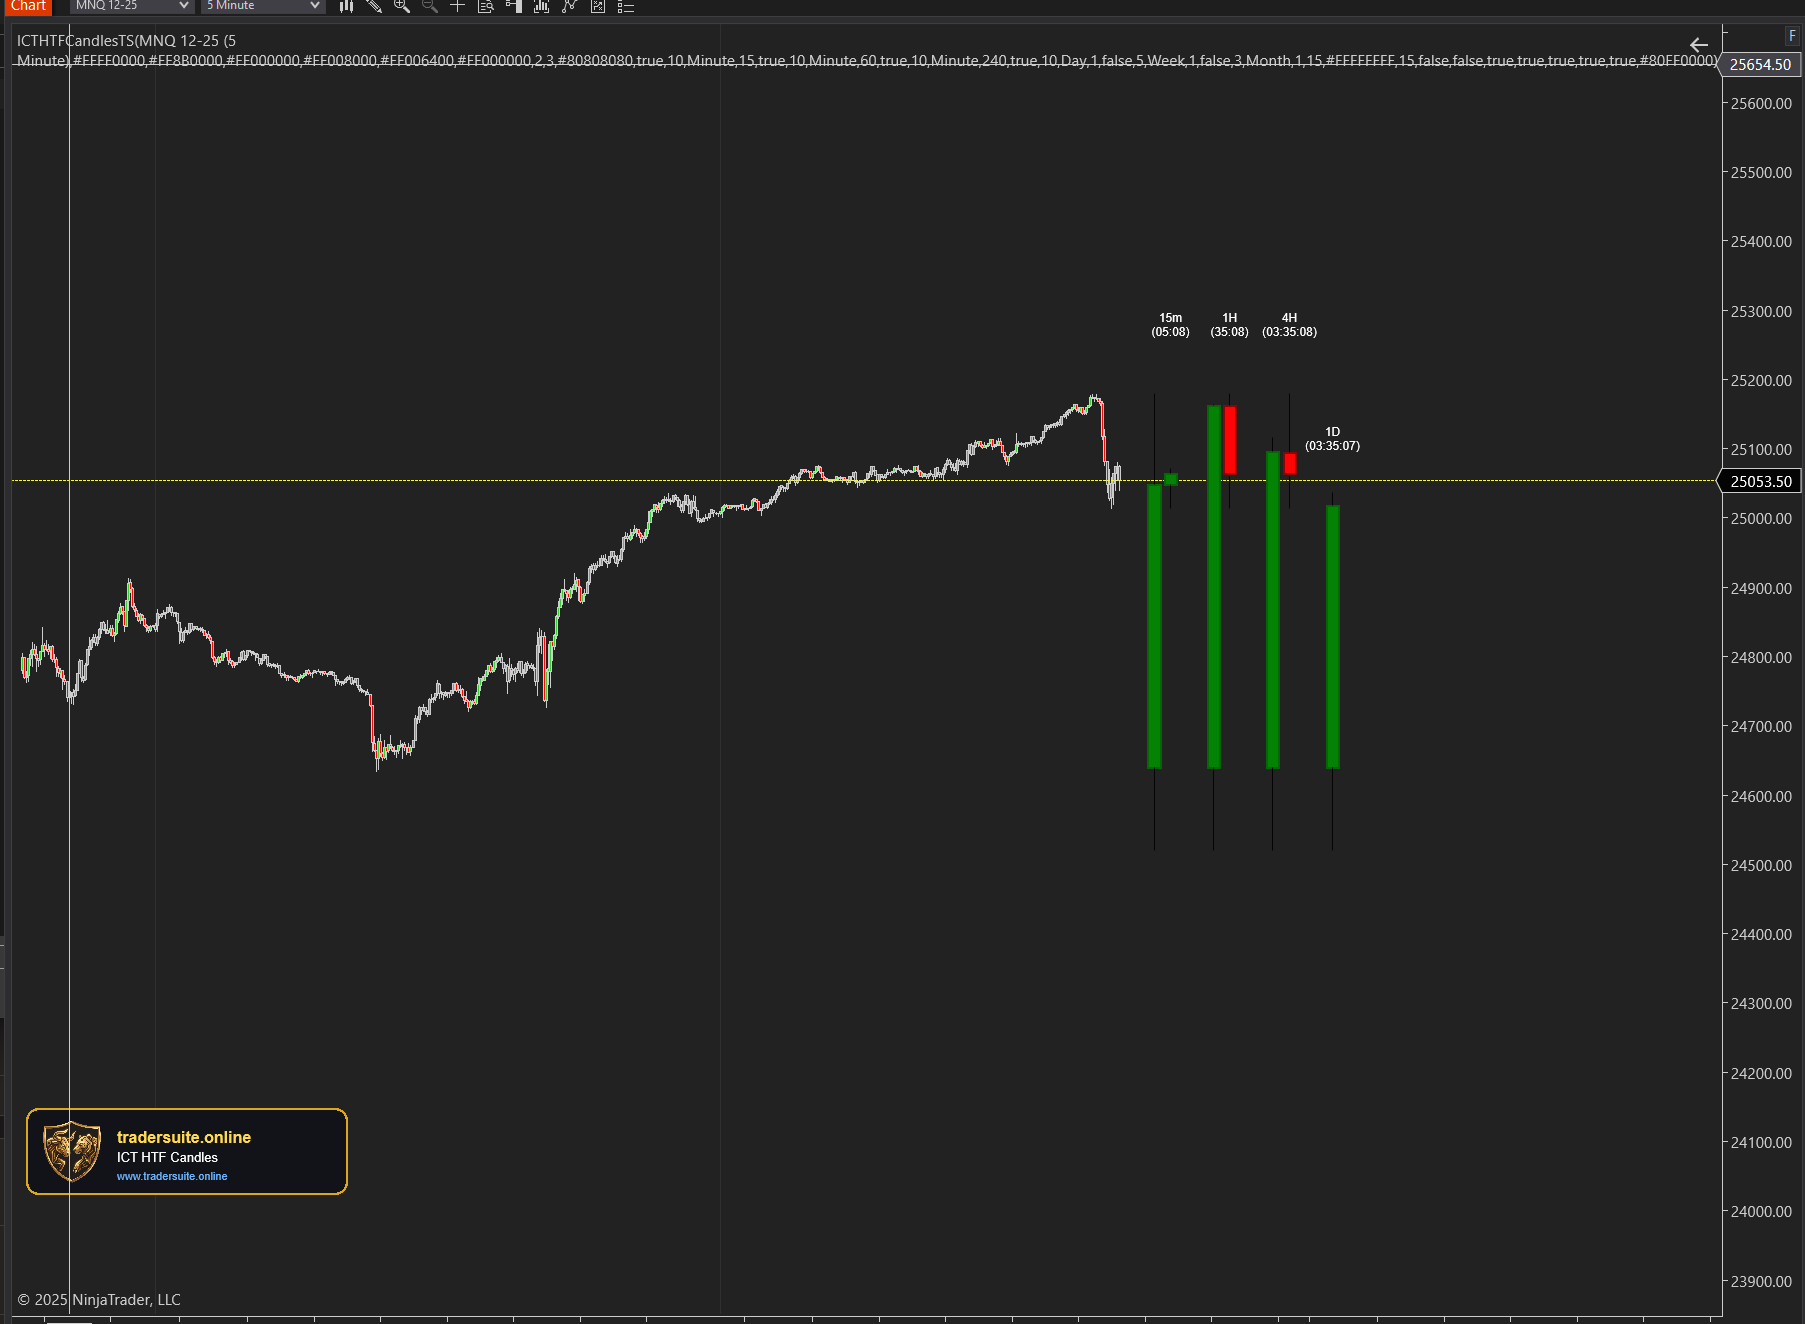
ICT HTF Candles Pro
Visualize multiple higher timeframe candles directly on your chart with real-time countdown timers, Fair Value Gap detection, and Volume Imbalance highlighting. Perfect for ICT traders who need multi-timeframe confluence without switching charts.
