
TS_Big_Radar_Pro
Tick-level big-money radar: heat bubbles mark every unusually large execution, sweep detection catches liquidity runs in milliseconds, and T/C signals tell you whether to ride the move or fade the trap. Auto-calibrates to any futures market.
Secure Download
Instant access
Lifetime Updates
Free forever
2 Activations
Per license
Documentation
Step-by-step guides
TS_BigTradeRadar_Pro
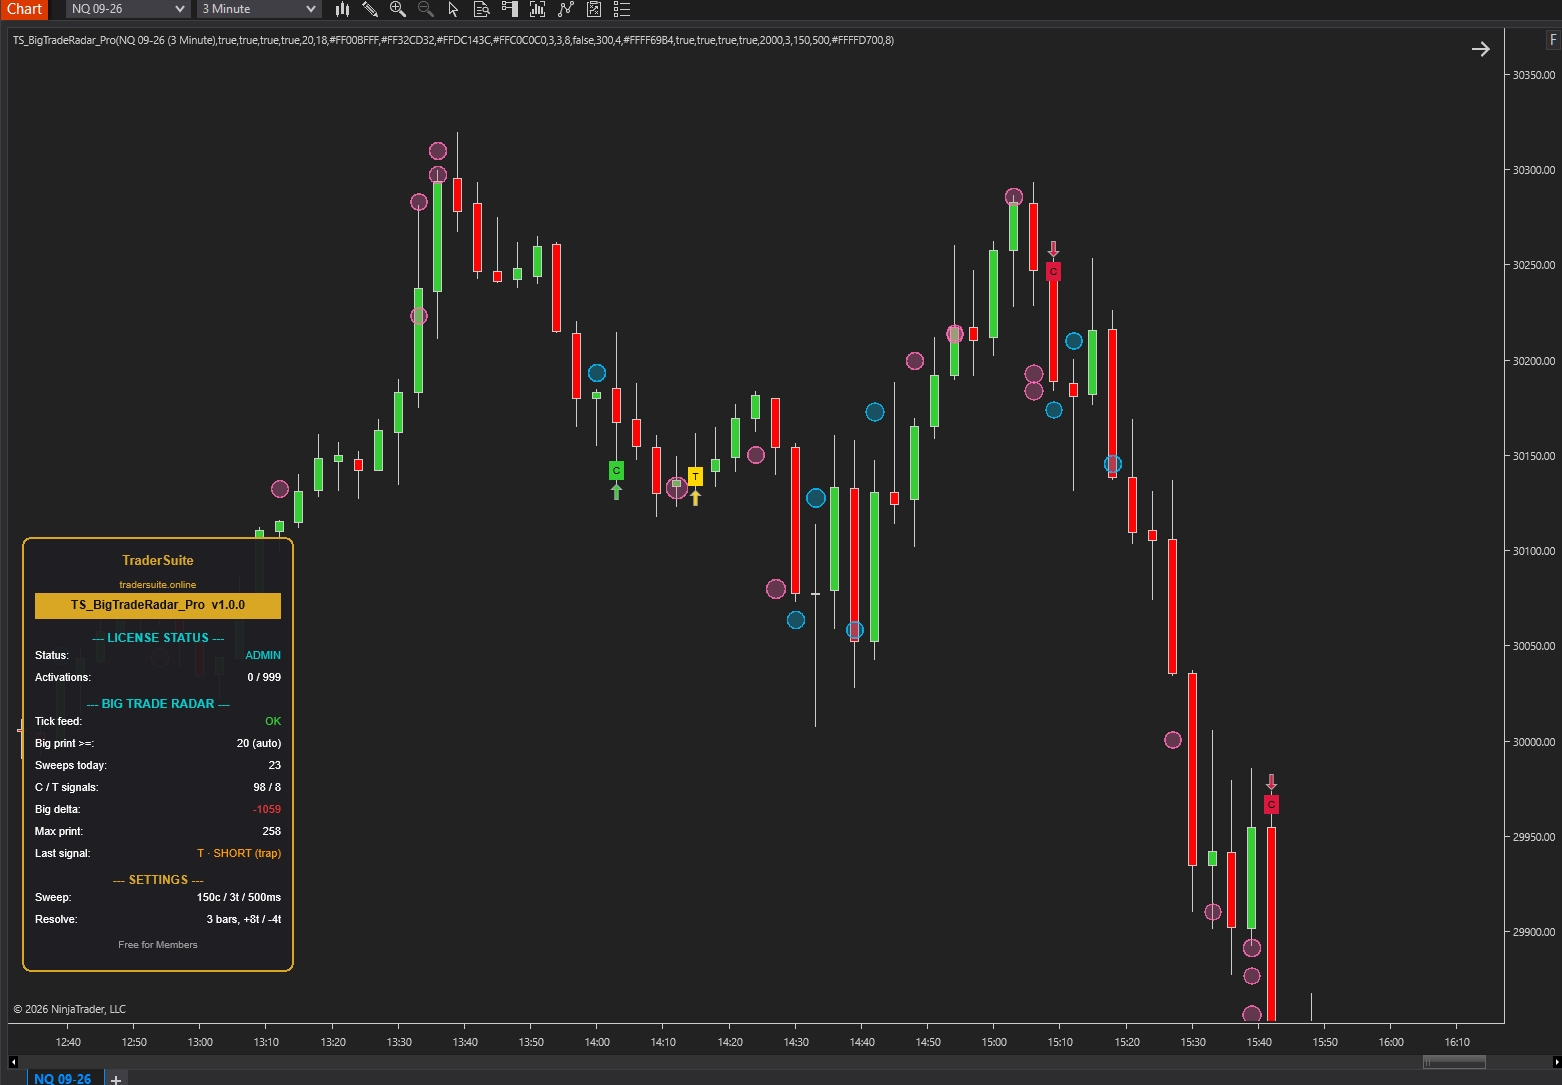
See the big money the moment it hits the tape. Heat bubbles show where size executed, sweep detection catches liquidity runs in milliseconds, and T/C signals tell you whether to ride the move — or fade the trap.
A volume spike is a question. This answers it.
A massive candle appears, price accelerates, and you have seconds to decide: is smart money really driving this — or is it a trap built to pull breakout traders onto the wrong side? Candle volume can't tell you, because it mixes institutional size with retail noise. TS_BigTradeRadar_Pro reads the tape one execution at a time and answers the question visually.
See exactly where size executed
Heat bubbles mark every unusually large print at its exact price — bigger bubble, bigger trade. Clusters become visible hot zones.
Catch sweeps in milliseconds
When aggressive volume tears through multiple price levels inside half a second, the radar flags it instantly — the footprint size can't hide.
Trap or continuation — decided for you
Every sweep resolves into a C (ride it) or T (fade it) signal using mechanical price rules. No footprint-chart speed-reading required.
Big-money delta
A running total of institutional-sized flow only — retail noise filtered out. When price rises but big delta doesn't, you know who's absent.
Institutional levels, auto-drawn
When big prints stack on one price, a BIG MONEY level appears — the market's real interest zones without drawing a line yourself.
Automation-ready
Signal outputs (+2/+1/−1/−2) any NinjaScript strategy or Market Analyzer column can consume. No extra execution product required.
How to trade it — in plain English
The radar watches every trade that prints. When something unusually big happens, it draws a bubble. When big money charges through several prices at once, it waits a few bars and then stamps one of two letters on your chart. Those letters are the whole method:
C — the move is real. Go WITH it.
What happened: big money slammed through the market and price kept going. Nobody stepped in front of it.
What you do: trade in the arrow's direction — green C arrow up = long, red C arrow down = short. Enter on the signal bar or the first small pullback.
Stop: behind the bubble cluster the move launched from. Target: next obvious level (pair it with TS_GammaLevels_Pro walls for ready-made targets).
T — it was a trap. Go AGAINST it.
What happened: big money charged in one direction, got absorbed, and price snapped back. The aggressors are trapped in losing positions — their exits now fuel the reversal.
What you do: trade in the gold arrow's direction (already flipped against the trapped side for you). Trapped buyers = short signal. Trapped sellers = long signal.
Stop: tight, just beyond the trap's extreme — that's the beauty of T trades. Target: the far side of the range the sweep started from.
The three golden rules
1. No letter, no trade. Bubbles alone are information, not entries. Wait for the C or T stamp — that's the market showing its hand.
2. Respect the bubble clusters. A price with stacked bubbles is where big money cares. Entries near clusters, stops beyond them, targets at the next one.
3. Check the big delta before sizing up. C-long with rising big delta = conviction. C-long while big delta falls = suspicion — take the smaller size.
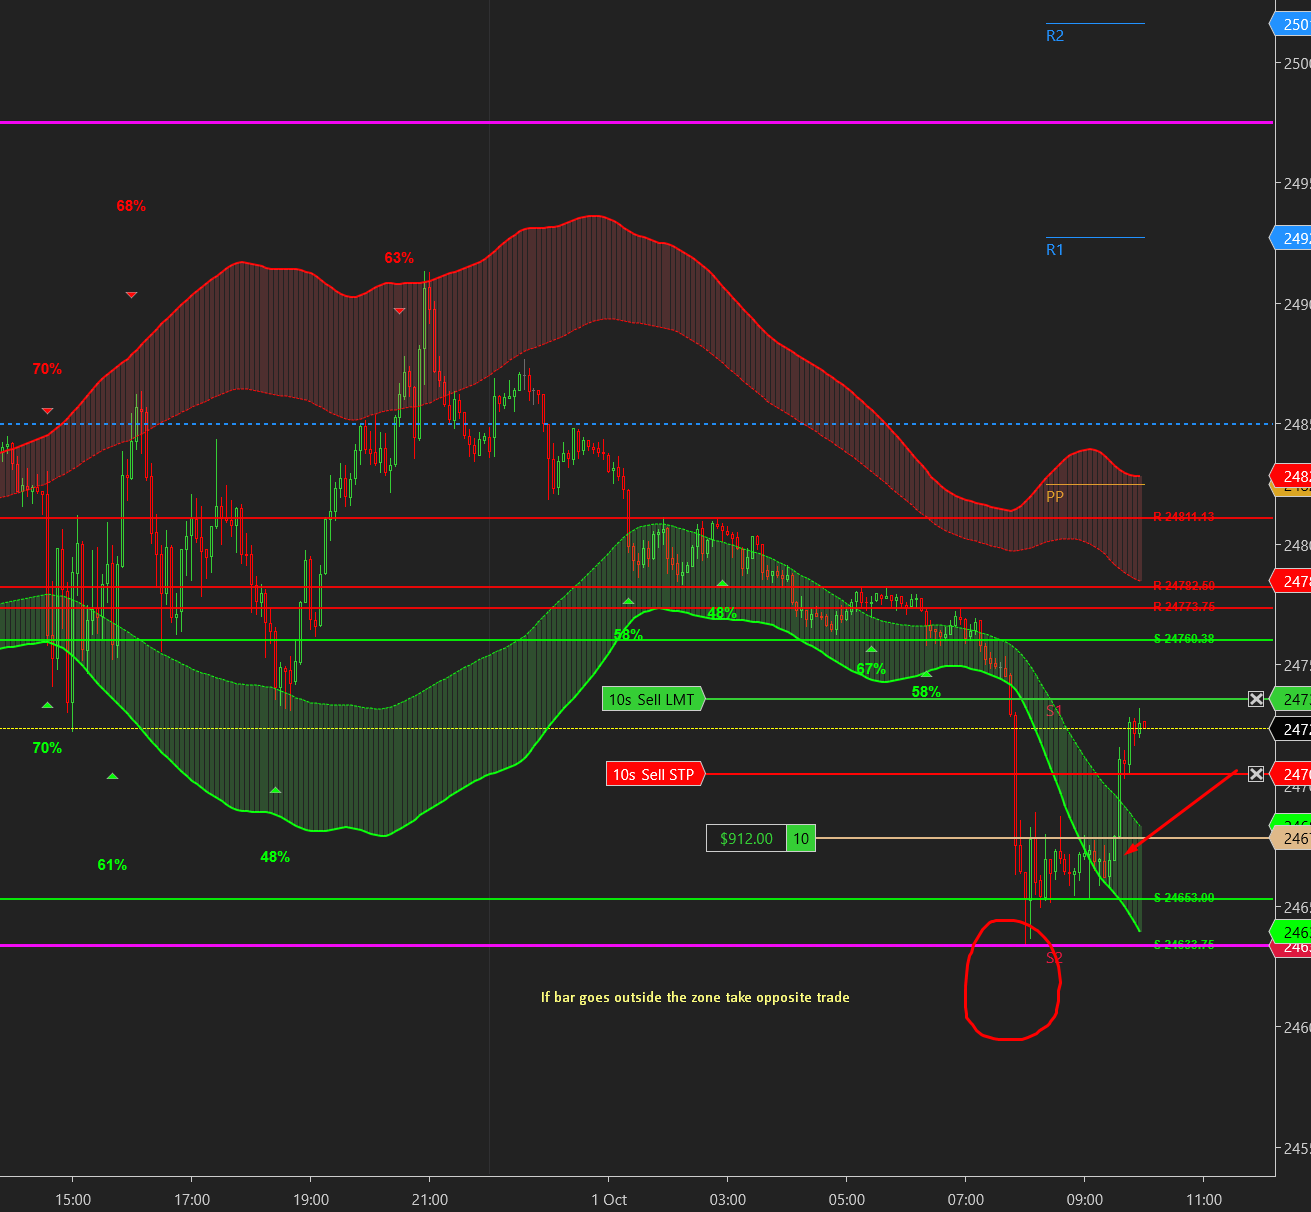
Anatomy — every element explained
Same spike, opposite trades
Every sweep gets a few bars to prove itself. The resolution is purely mechanical — no judgment calls:
Left: buyers swept and price extended beyond the sweep's high — momentum accepted, C long. Right: the same buy sweep got absorbed and price closed back below where it started — buyers trapped, T short. If neither happens within the confirmation window, the sweep quietly expires: no signal, no noise.
The session playbook
Let it calibrate, then trust the bubbles
With Auto-Calibrate on, the radar learns the instrument's normal tick size within minutes. From then on, every bubble is genuinely unusual size — treat clusters as the session's real interest zones.
Trade the letters, in context
C signals shine in trending conditions; T signals are gold at range extremes, prior highs/lows, and — best of all — at levels from your other TraderSuite tools. A T-short printing at a GammaLevels call wall, or a C-long at a measured-move confluence, is the stacked trade.
Automate or scan when ready
Both outputs are strategy-consumable — no extra execution product needed:
// +2 C-long, +1 T-long, -1 T-short, -2 C-short
var radar = TS_BigTradeRadar_Pro(/* params */);
if (radar.Signal[0] == 2)  EnterLong();
if (radar.Signal[0] == -1) EnterShort(); // fade trapped buyers
Do
- Wait for the C/T stamp — the sweep alone is only half the story.
- Put stops beyond bubble clusters, not round numbers.
- Use T signals for tight-stop reversals at extremes.
- Cross-check the big delta row before adding size.
- Keep chart lookback moderate — tick data loads per session.
Don't
- Don't treat every bubble as an entry — information ≠ trigger.
- Don't fade a C signal because price "looks extended."
- Don't trade the first minutes after connect while calibration settles.
- Don't expect identical historical/live prints — the tape is approximated historically.
- Don't run it on illiquid instruments — big-print detection needs real flow.
Reading the panel
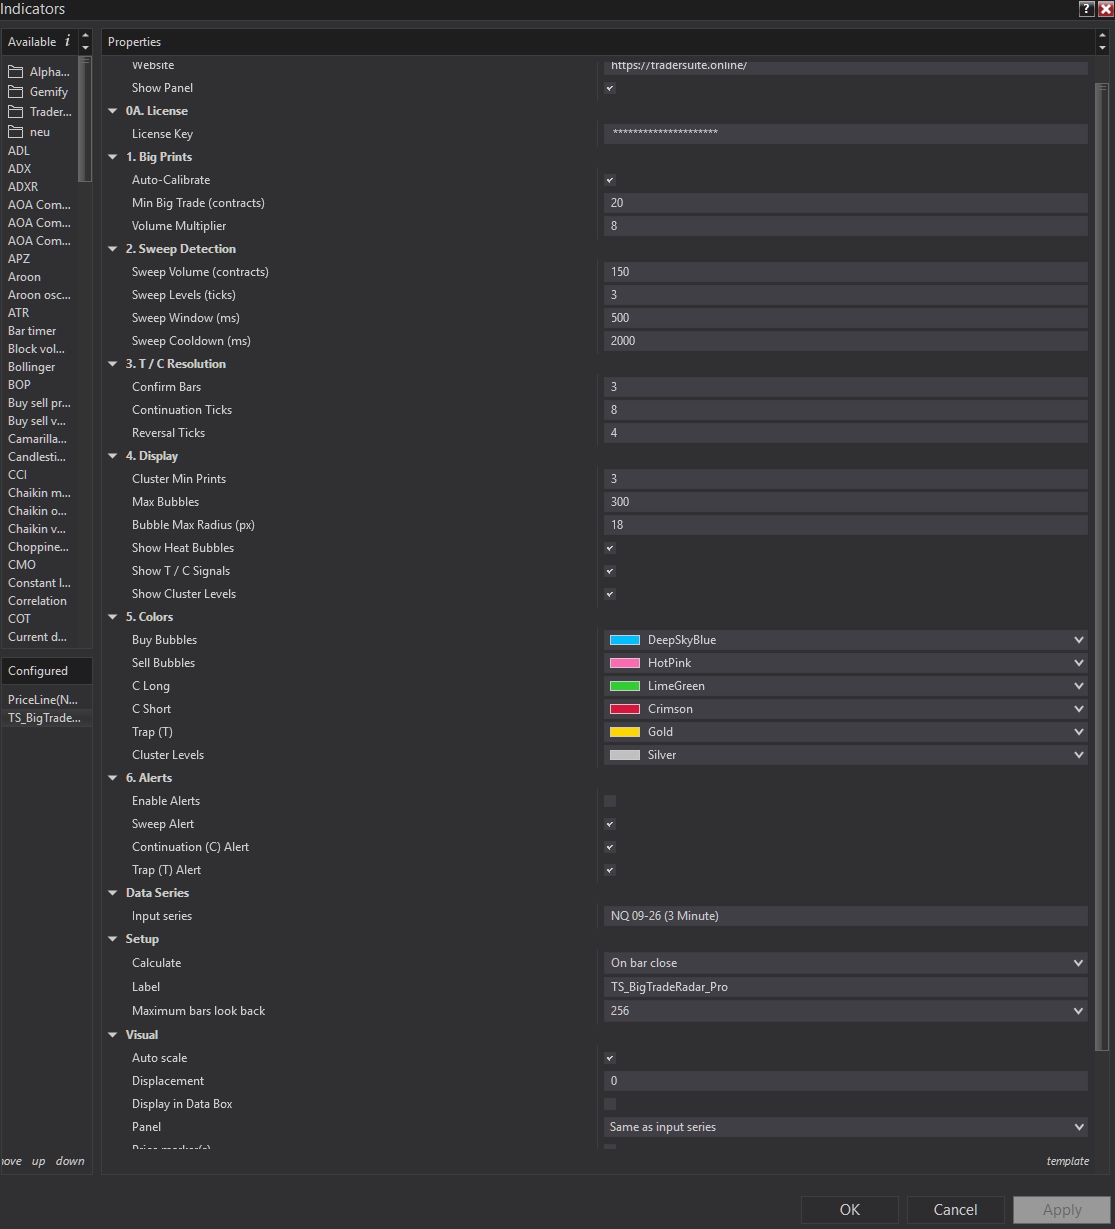
Installation & the settings that matter
Install in 3 steps
1) NinjaTrader 8 → Tools → Import → NinjaScript Add-On. 2) Add TS_BigTradeRadar_Pro to a liquid futures chart (NQ 1–5 min is the sweet spot) — first load downloads tick data, give it a moment. 3) 7-day free trial starts automatically; enter your key under 0A. License after purchase.
Auto-Calibrate
Learns the instrument's normal tick volume and scales the big-print threshold automatically. Turn off only if you want fixed contract thresholds.
Sweep Volume / Levels / Window
What counts as a sweep: this much same-side volume, through this many prices, this fast. Raise volume on ES; lower on quieter markets.
Confirm Bars + Ticks
How a sweep must resolve: extend 8 ticks beyond the extreme = C; close 4 ticks back through the origin = T; otherwise it expires silently.
Cluster Min Prints
Big prints stacked on one price before a BIG MONEY level draws. Raise it for only the strongest zones.
Bubbles
Visual budget. Lower the max on slower machines; shrink the radius on compressed charts.
Alerts
Independent toggles for sweep detected, C signals, and T signals — turn on T alerts even if you trade nothing else; traps are the highest-information events.
FAQ
Does it really see institutional orders?
It sees what the tape shows: unusually large and unusually fast executions. No retail product can identify who traded — anyone claiming otherwise is marketing. What the radar guarantees is that the prints it marks are statistical outliers versus normal flow on your instrument, which is the honest, useful definition of "big money footprints."
How is buy vs sell decided?
By the tick rule: trades on upticks count as aggressive buying, downticks as selling. It's the standard approximation when bid/ask context isn't available historically — consistent, fast, and the same rule live and in history.
Why do live and historical bubbles differ slightly?
Live you see every execution as it happens; historically NT8 reconstructs from stored tick data. Signals use the same rules both ways, but tiny differences in tick sequencing can shift borderline events. Judge the tool live or on recent data.
Which instruments and timeframes?
Liquid futures are ideal: NQ, ES, GC, CL, RTY on 1–5 minute charts. Auto-Calibrate adapts the thresholds per instrument. Avoid illiquid symbols — without real flow there are no meaningful big prints.
Why is my chart slow to load?
The radar hosts a 1-tick data series, so the first load downloads tick data for your chart's range. Keep lookback to a few days on minute charts and it stays snappy.
Do signals repaint?
No. Sweeps are detected in real time and the C/T stamp prints on the bar that resolves it — once printed, it never moves or disappears.
Can my strategy trade it automatically?
Yes — read the Signal plot (+2/+1/−1/−2) and the BigDelta plot from any NinjaScript strategy or Market Analyzer column. See the snippet in the Playbook.
Related Products
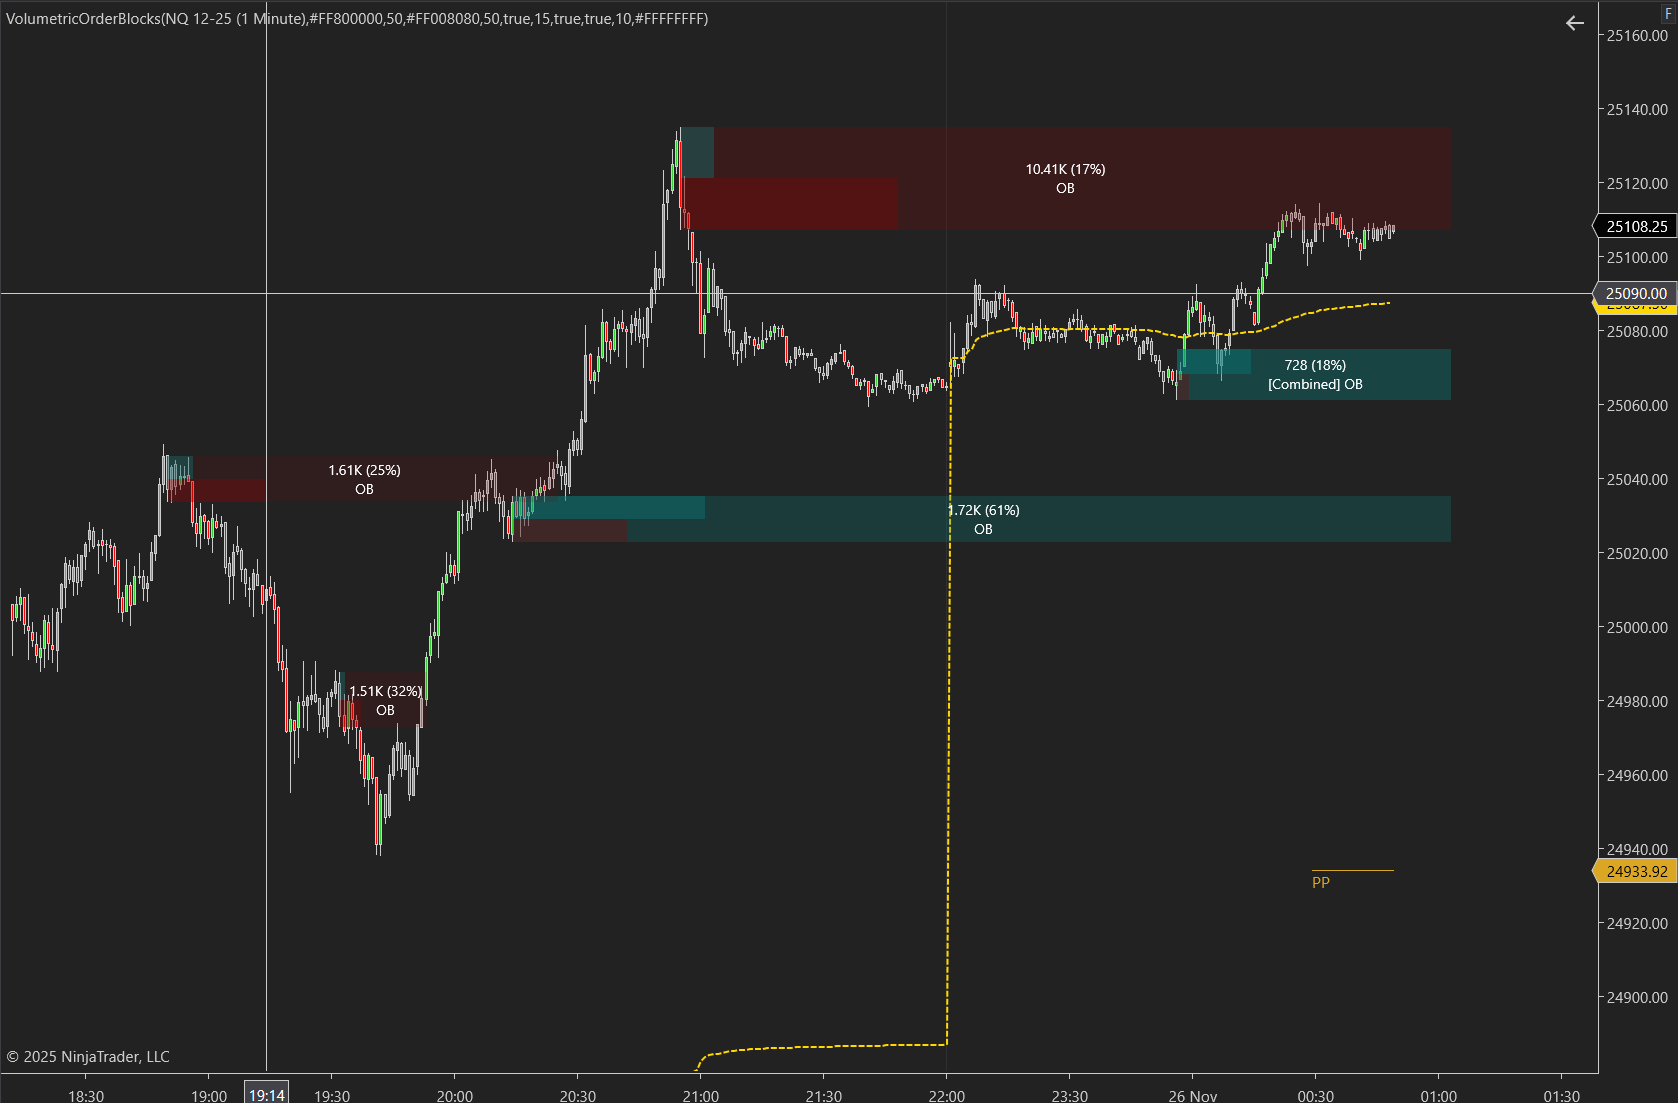
Volumetric Order Blocks Pro
Automatically detect institutional supply & demand zones with volume-weighted order blocks. Identify high-probability reversal zones where smart money is positioned.
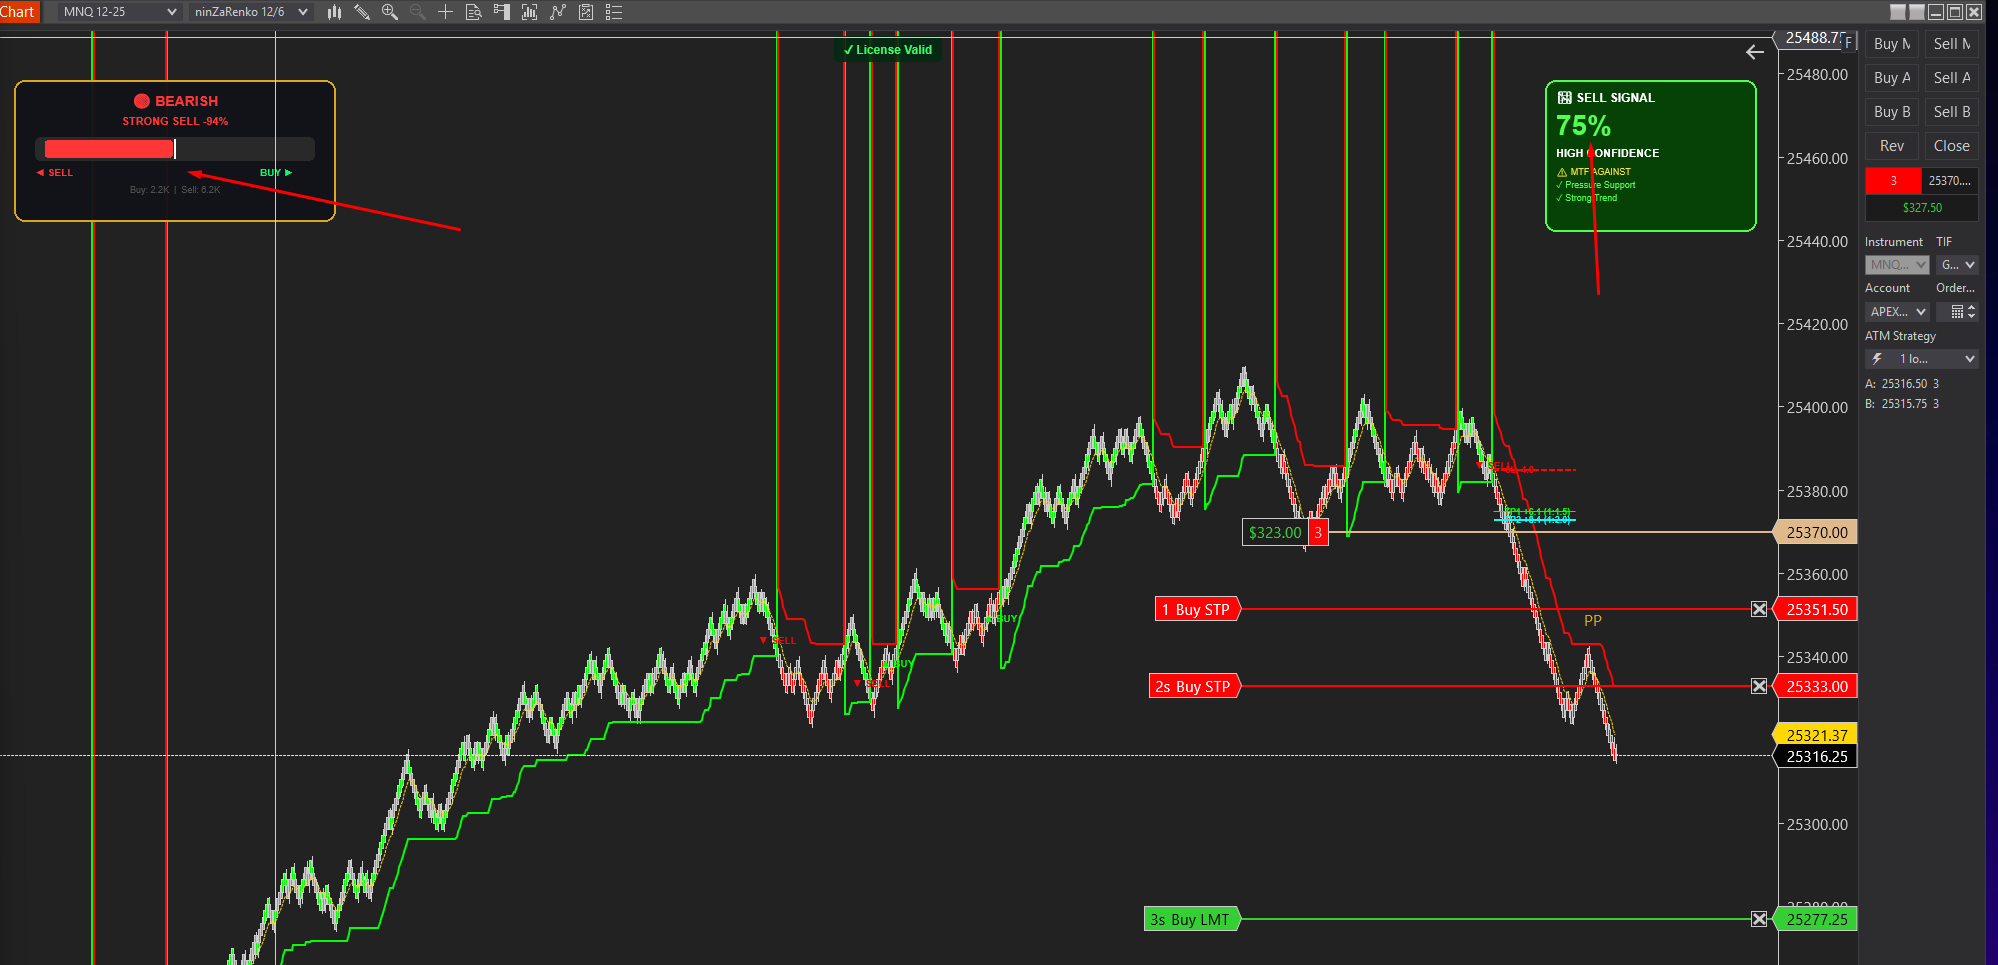
Smartflowpro
Advanced order flow analysis with real-time Pressure Delta Meter, multi-timeframe confluence scoring, and intelligent signal probability rating. Know who's in control before you trade.
UltraADXVolatilityWaves
Professional ADX-powered volatility zones indicator with dynamic Support/Resistance, Daily/Weekly levels, ATR-based TP/SL targets, and probability-scored signals. Identify high-probability reversal zones in real-time.
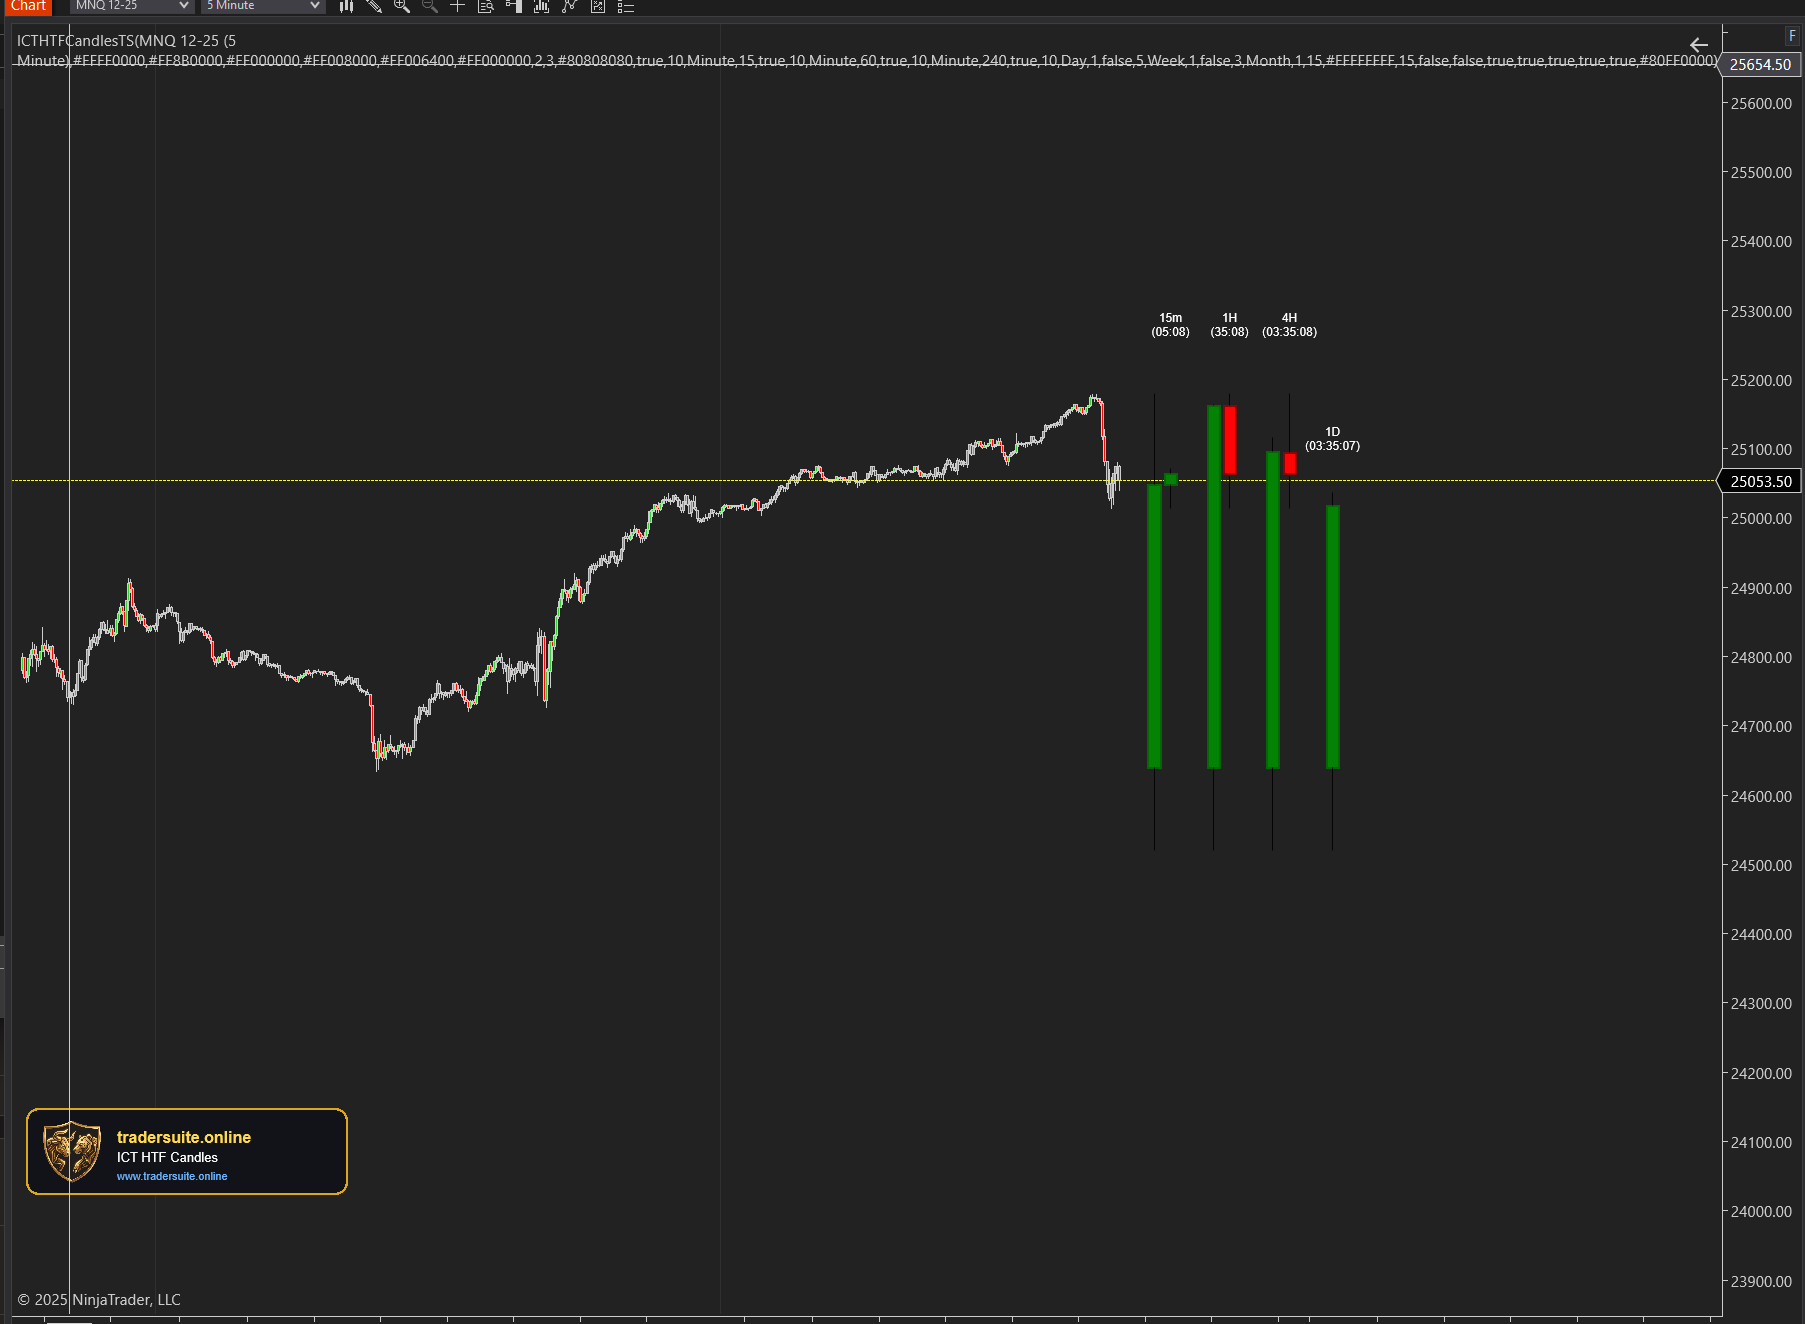
ICT HTF Candles Pro
Visualize multiple higher timeframe candles directly on your chart with real-time countdown timers, Fair Value Gap detection, and Volume Imbalance highlighting. Perfect for ICT traders who need multi-timeframe confluence without switching charts.
