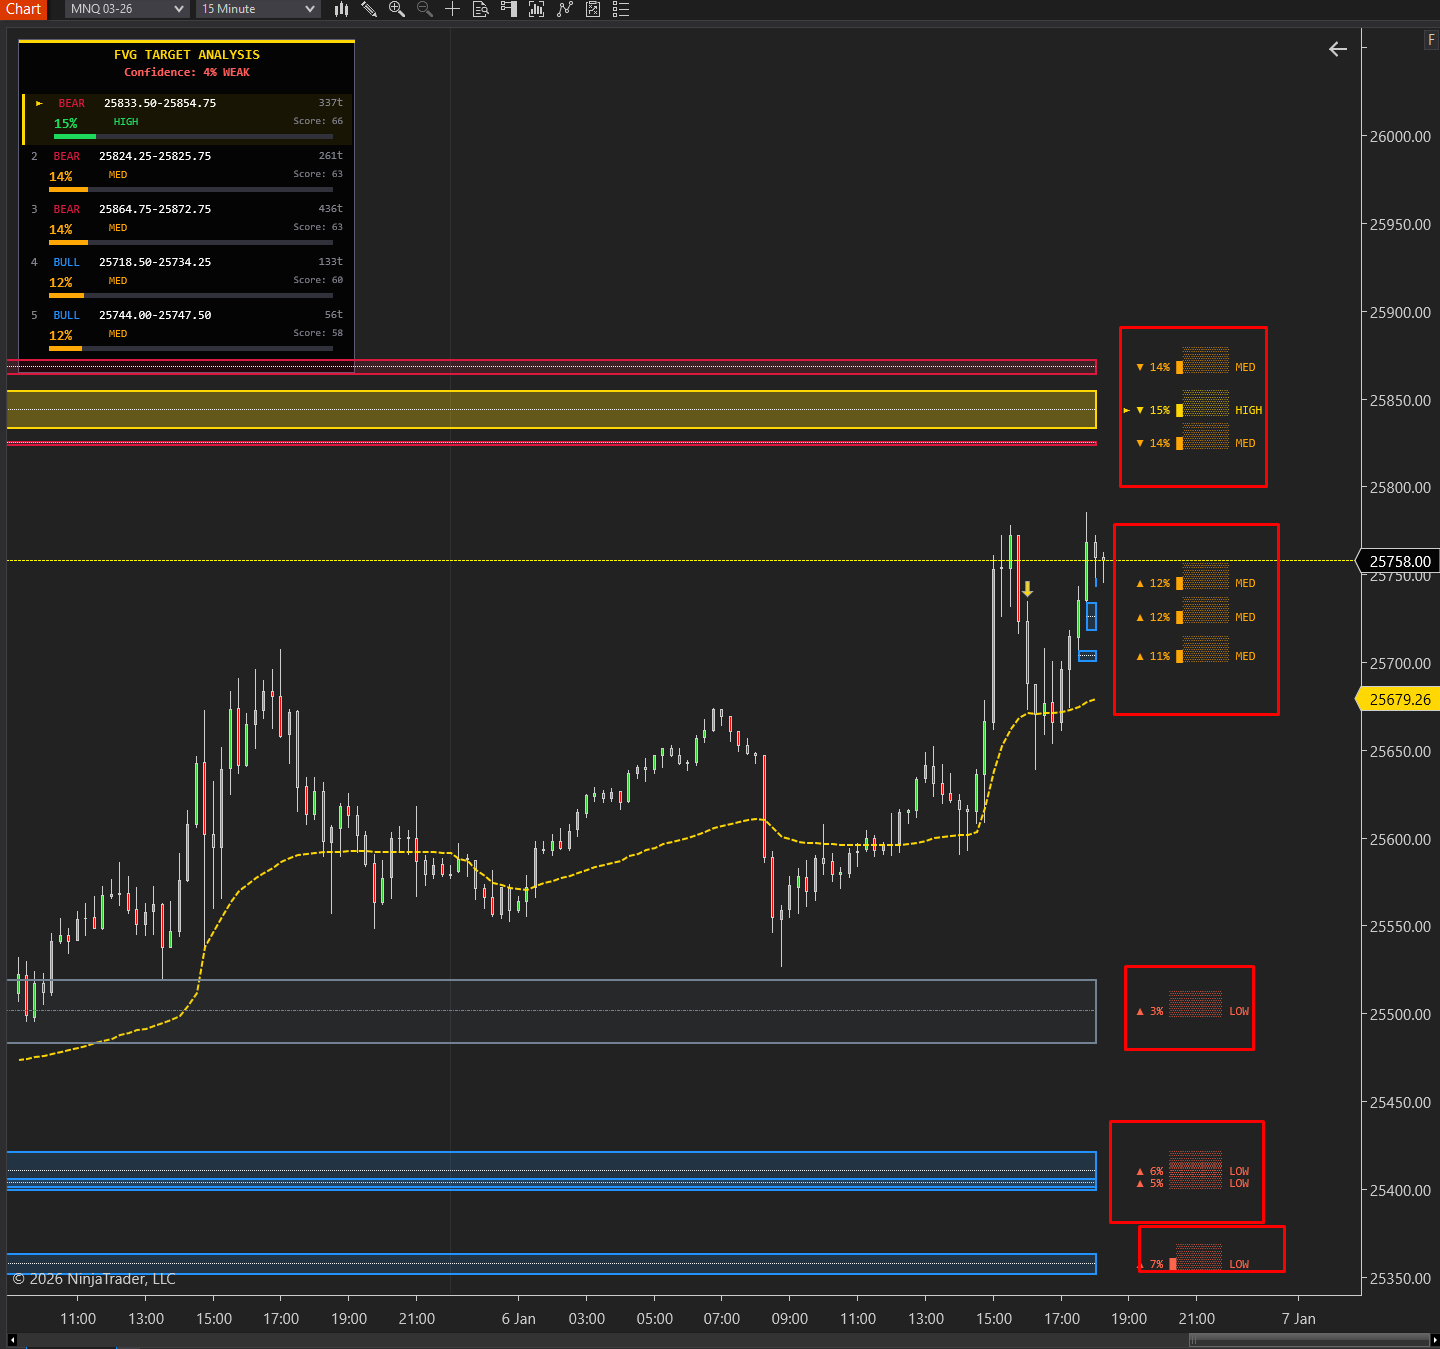
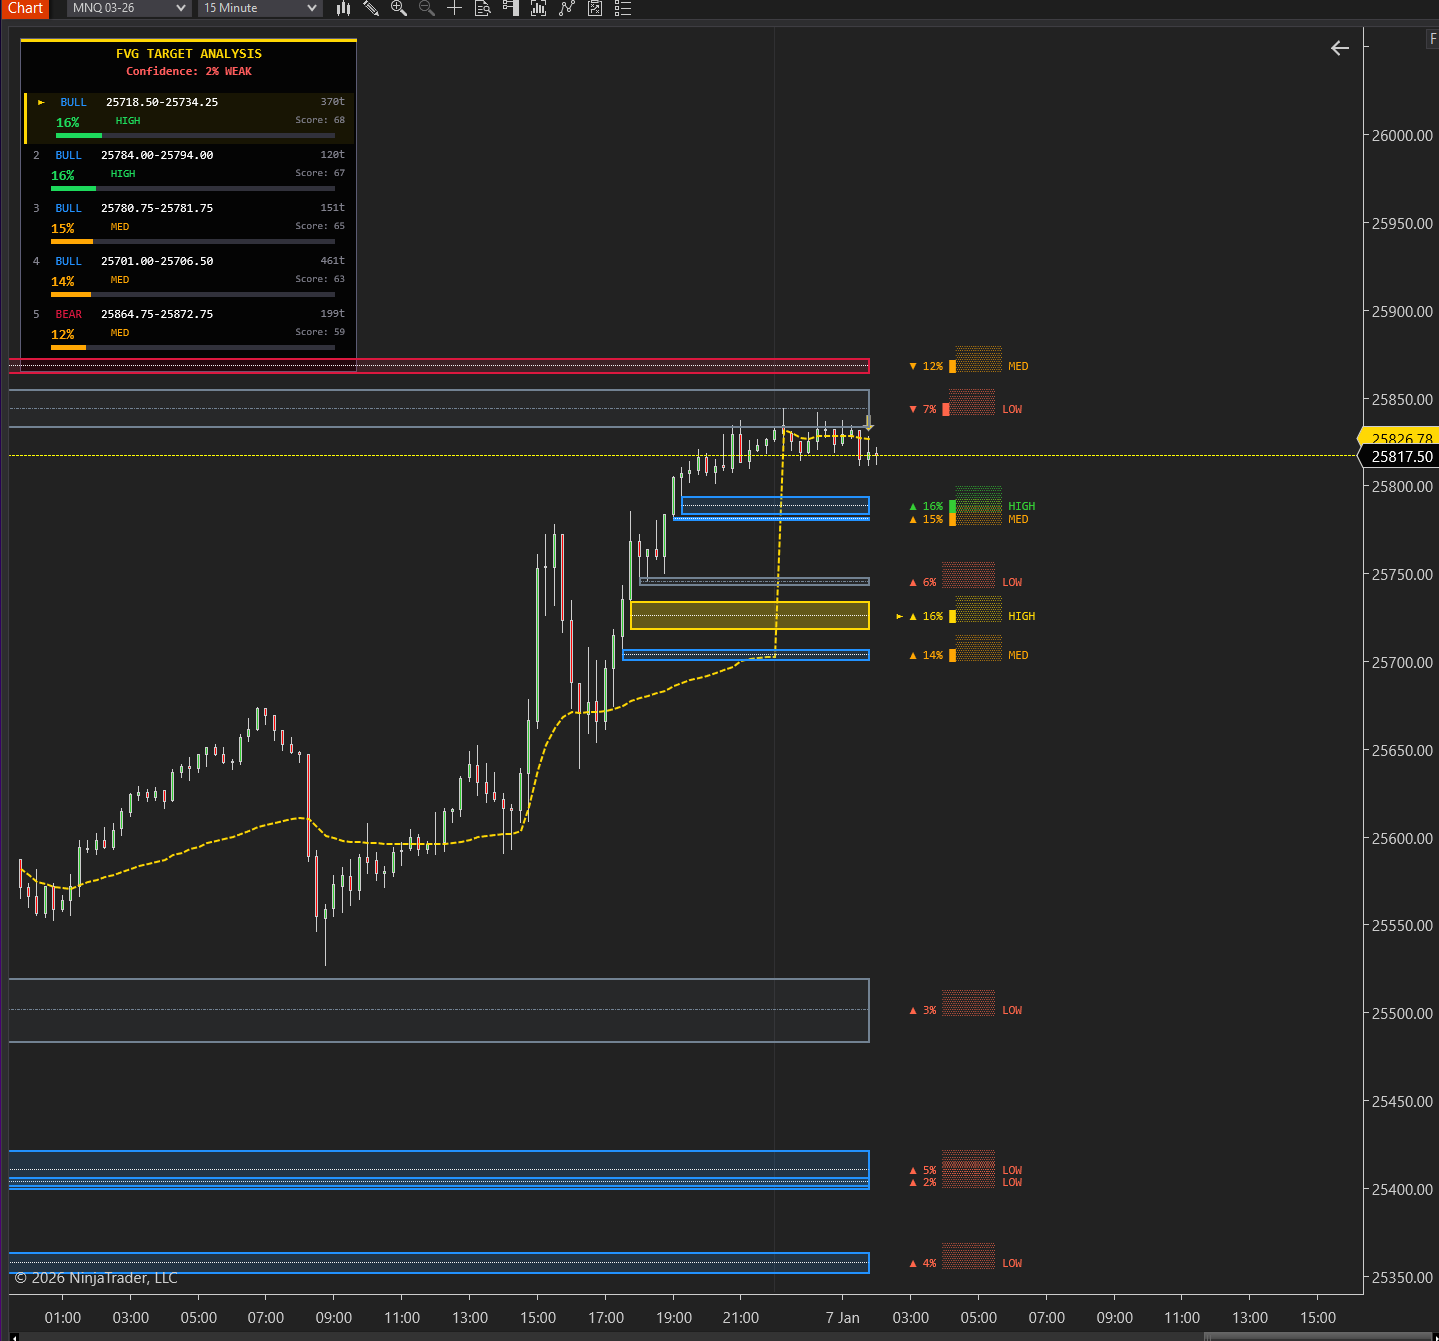
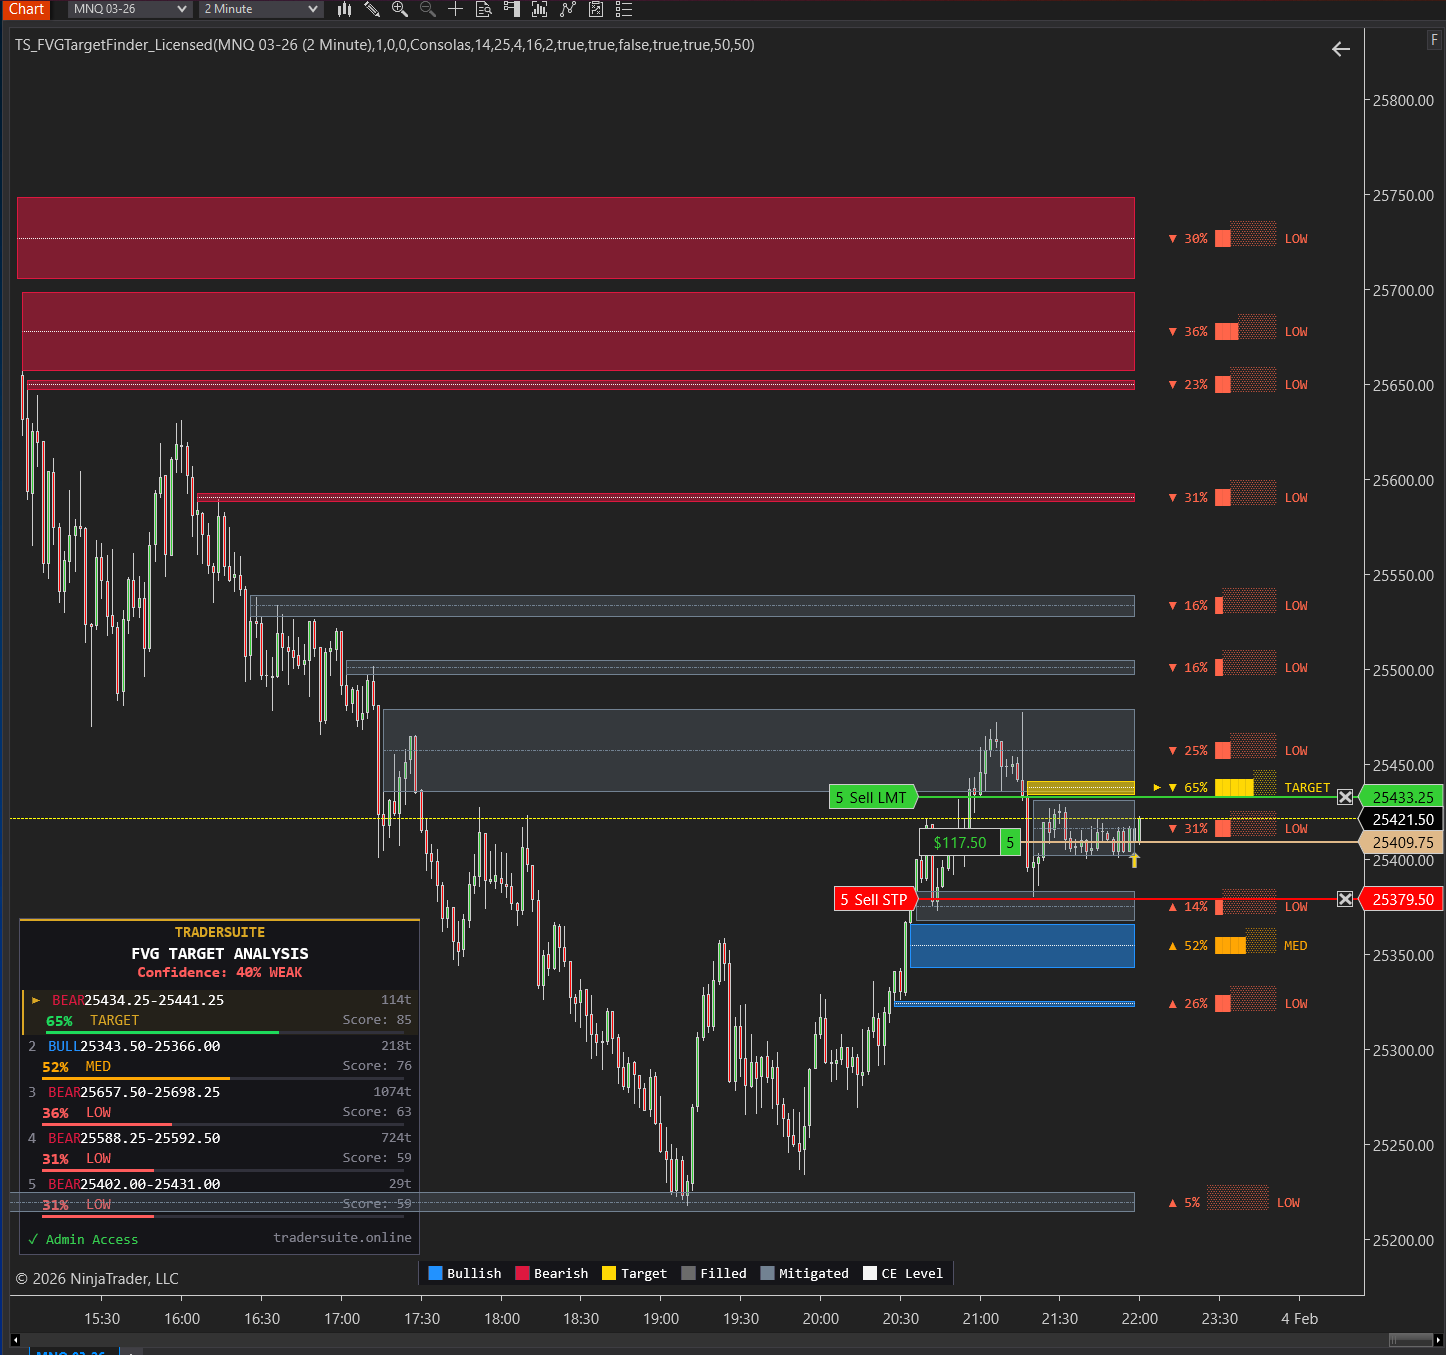
FVG Target Finder
Advanced Fair Value Gap (FVG) detector with multi-factor scoring algorithm that identifies which imbalance the market will target next. Features probability analysis, confidence rating, colorful SharpDX panel, and customizable display options. Supports both wick-based and body-based FVG detection modes.
Secure Download
Instant access
Lifetime Updates
Free forever
2 Activations
Per license
Documentation
Step-by-step guides
Product Demo
Related Products
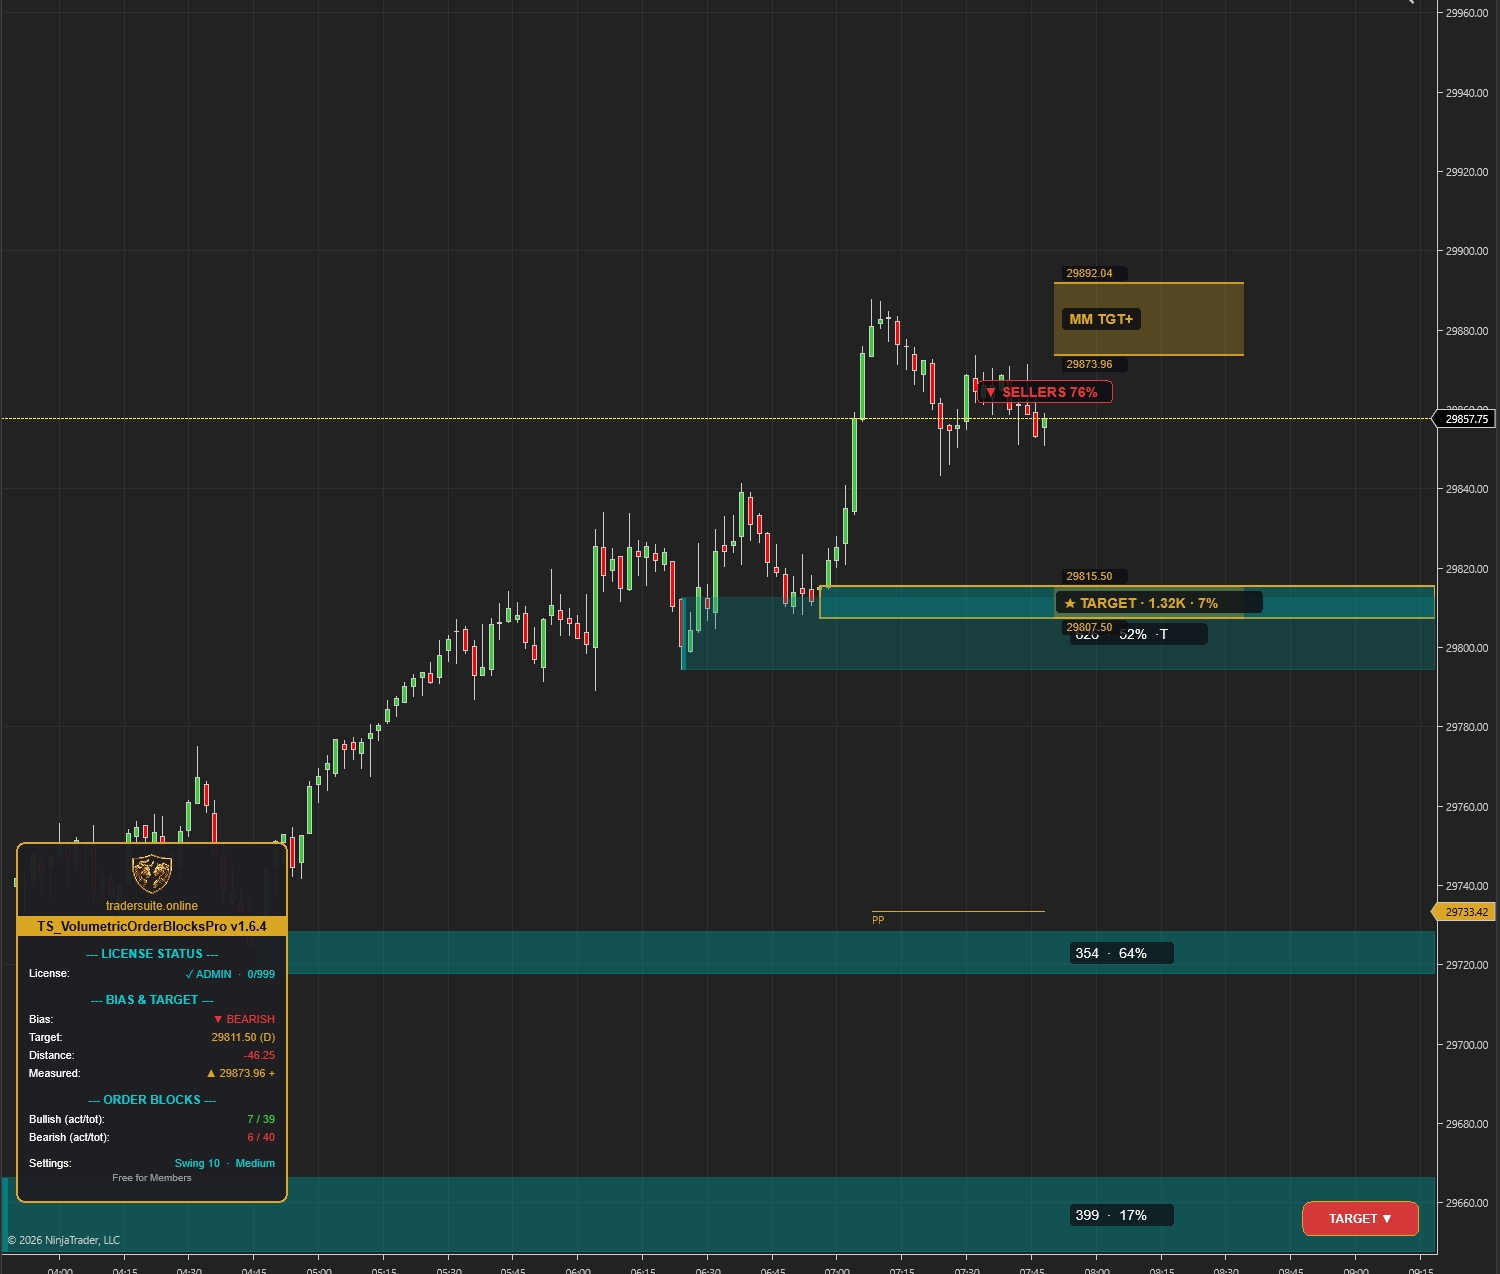
Volumetric Order Blocks Pro
Automatically detect institutional supply & demand zones with volume-weighted order blocks. Identify potential reversal zones where smart money is positioned.
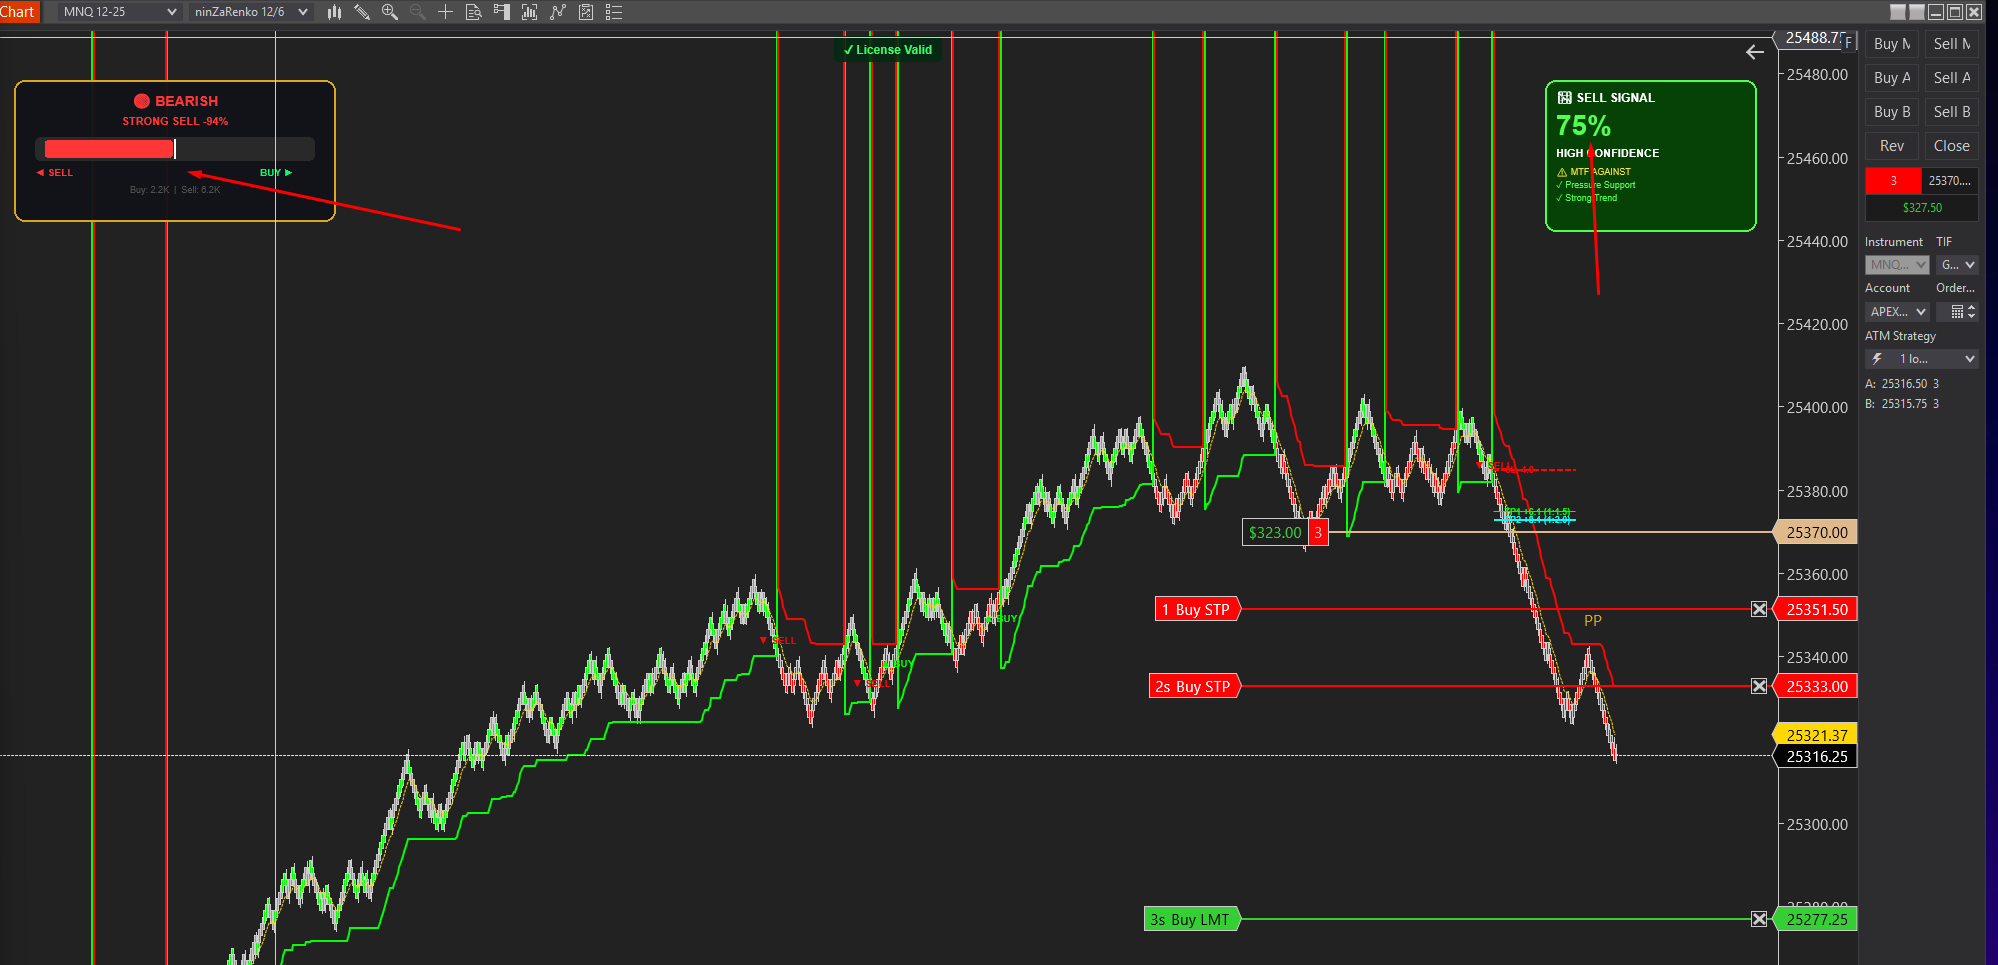
Smartflowpro
Advanced order flow analysis with real-time Pressure Delta Meter, multi-timeframe confluence scoring, and intelligent signal probability rating. Know who's in control before you trade.
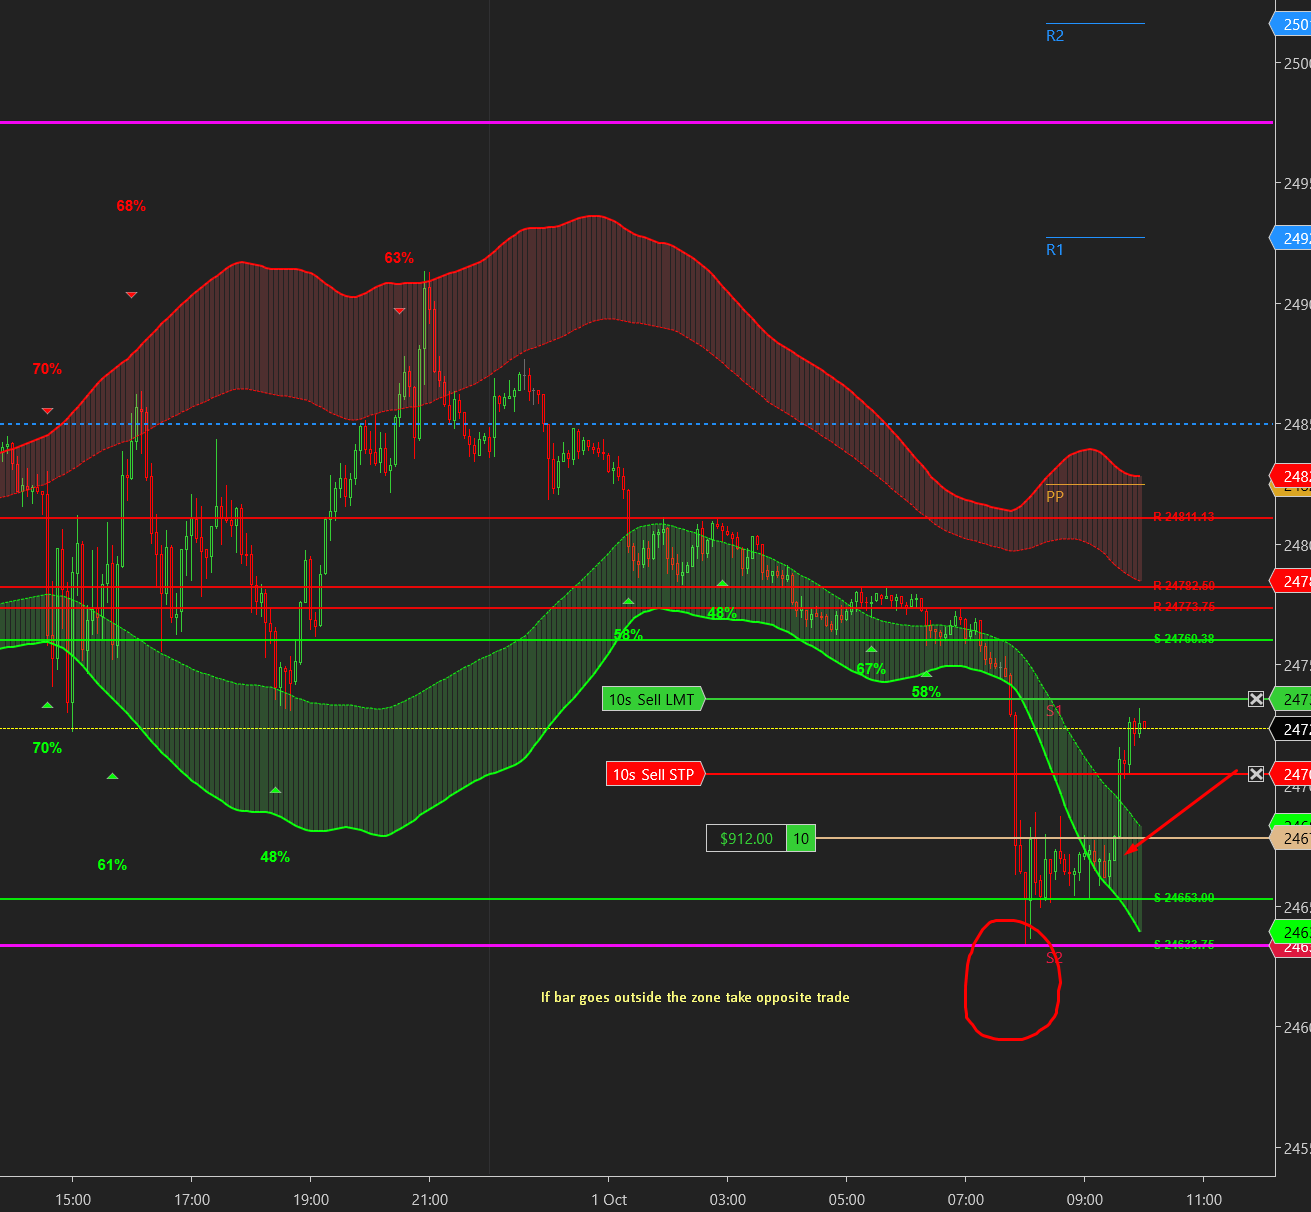
UltraADXVolatilityWaves
Professional ADX-powered volatility zones indicator with dynamic Support/Resistance, Daily/Weekly levels, ATR-based TP/SL targets, and probability-scored signals. Identify potential reversal zones in real-time.
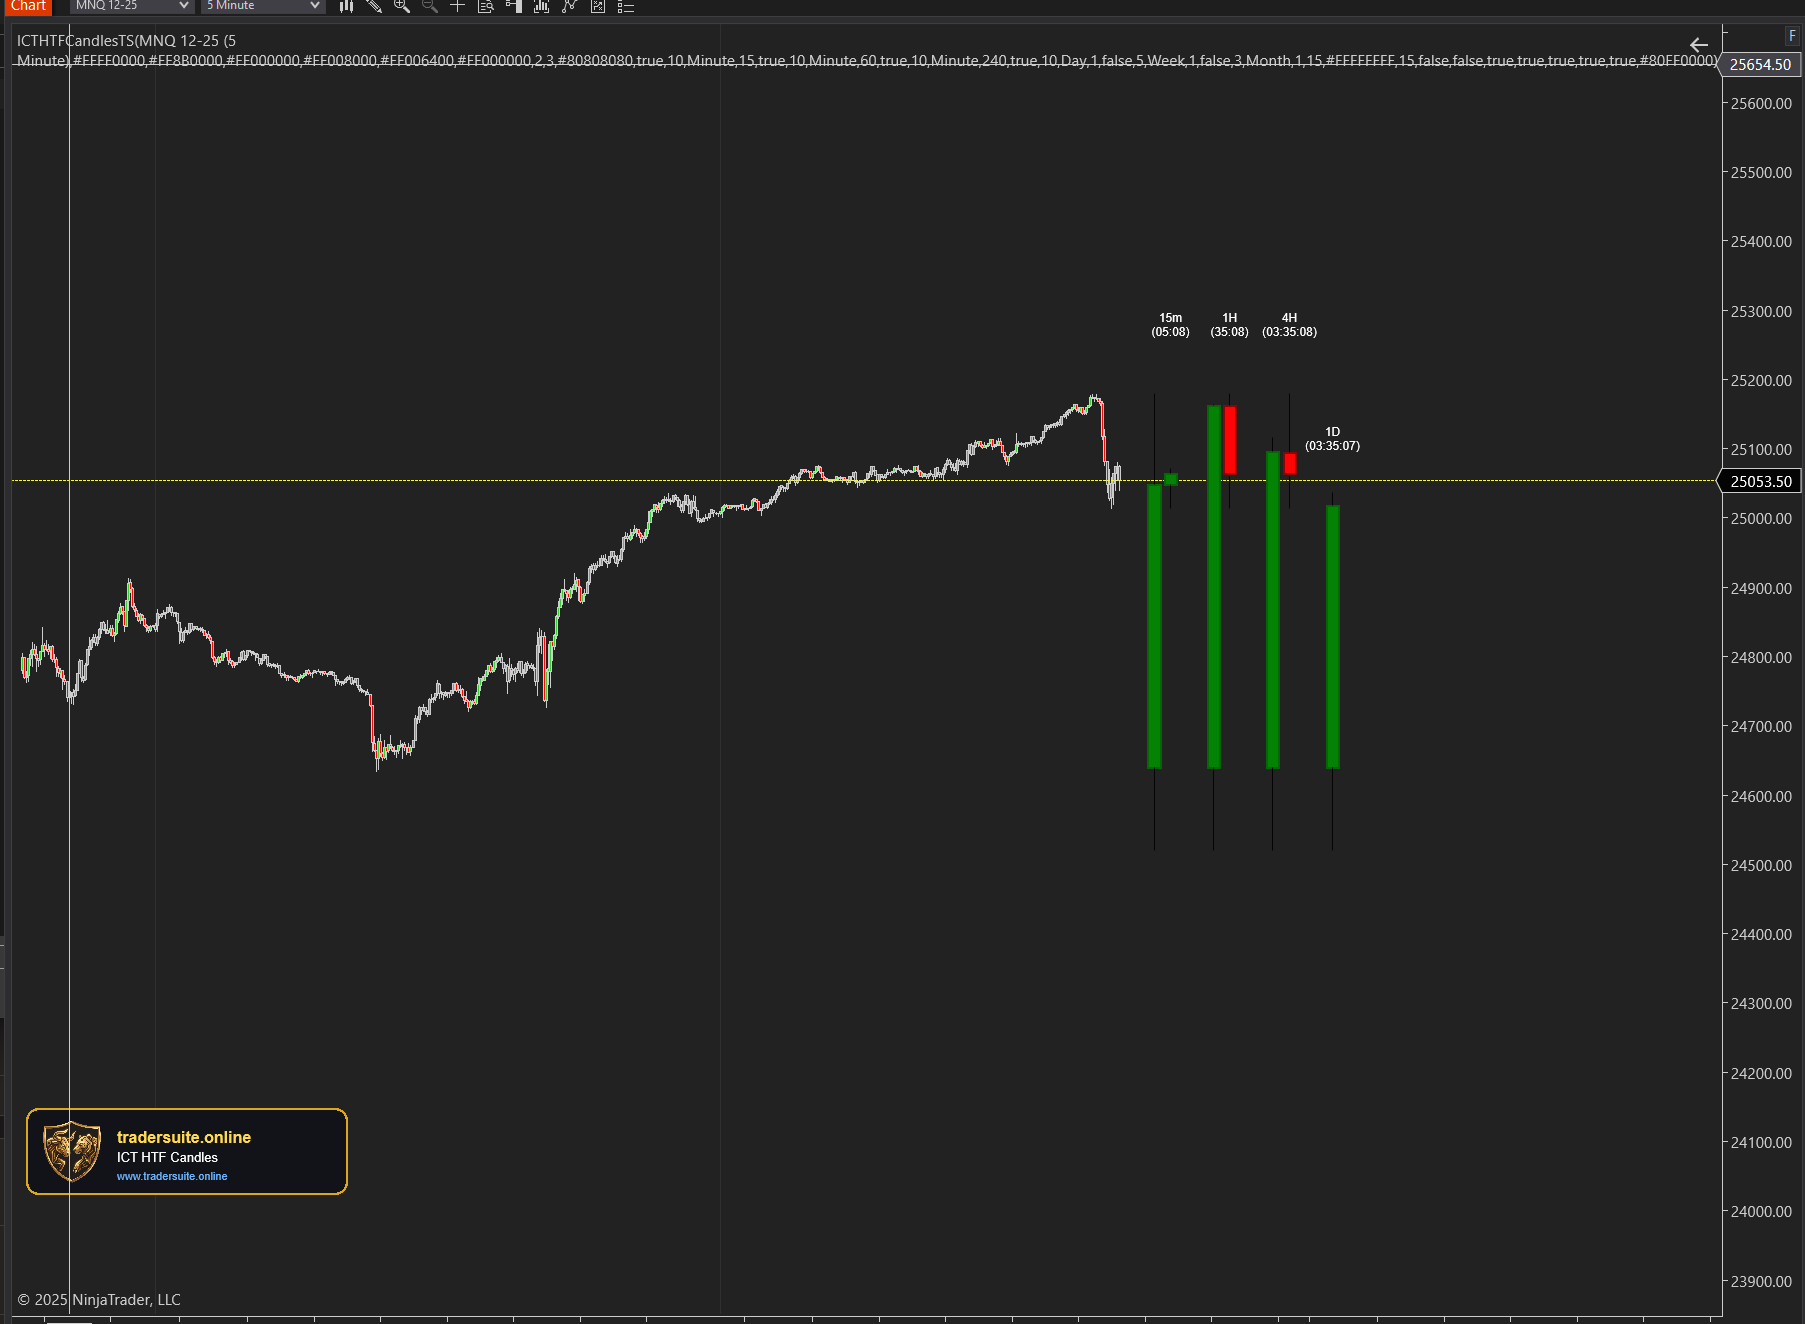
ICT HTF Candles Pro
Visualize multiple higher timeframe candles directly on your chart with real-time countdown timers, Fair Value Gap detection, and Volume Imbalance highlighting. Perfect for ICT traders who need multi-timeframe confluence without switching charts.